Monday, February 17, 2014

Hold on tight were in for quite a bumpy ride.

Most Australians are completely ignorant as to what happens in the rest of the world because they consider it to be "irrelevant" to their daily mundane banal lives, however the truth is that the massive economic problems that currently sweeping across Europe, Asia and South America are going to be affecting every Australian very soon. Sadly, most of the big news organizations in Oz seem to be more concerned about "the Block, State of Origin, AFL and the X Factor than about the horrible financial nightmare that is gripping emerging markets all over the planet. after a brief period of relative calm, we are seeing signs again of global financial instability that are unlike anything that we have witnessed since the financial crisis of 2008. the problems arent just isolated to a few countries. This time is truly a global phenomenon.
over the past few years, the US Fed and along with other global central banks have inflated unprecedented financial bubble with reckless money printing. this "hot money" poured into emerging markets all over the world. now that the Fed has begun "tapering" quantitative easing, investors are and those who pay attention and beginning to panic and taking this as a sign that the party is ending. Money is being pulled out of emerging markets all over the globe at a staggering pace and this is creating a tremendous amount of financial instability as people looking to hedghe their savings in Cryptocurriencies and precious metals, hence the wild swings in the likes of Bitcoin, Gold and silver. etc.
The Muthar of all Shit loads is about to hit the fan globally we are in for an economic Meltdown that will make the GFC of 2008 pale into insignificance. signs that the global economic crisis has started and at the point of No Return.


#1 The unemployment rate in Greece last week has hit a brand new record high of 28%

#2 youth unemployment rate in Greece last week has hit a brand new record high of 64.1%.

#3 the percentage of bad loans underwater and bankruptcies in Italy is at an alltime record high.

#4 Italian industrial output declined again in December, and the Italian government is on the verge of collapse.

#5 The number of jobseekers in France has risen for 30 of the last 32 months, and at this point it has climbed to a new all-time record high in the countries history.

#6 The total number of business failures in France in 2013 was even higher than in any year during the last financial crisis.

#7 It is being projected that housing prices in Spain will fall another 15 to 20 percent as their economic depression deepens.

#8 The economic and political turmoil in Turkey is spinning out of control. The government has resorted to blasting protesters with rubber bullets and pepperspray in a desperate attempt to restore order.

#9 It is being estimated that the inflation rate in Argentina is now over 40 percent, and the peso is absolutely collapsing.

#10 Gangs of armed bandits are roaming the streets in Venezuela as the economic chaos in that troubled nation continues to escalate.

#11 China appears to be starting its deleveraging. the deflationary effects of this are going to be felt all over the planet far worse the the GFC of 2008. China's Xi Jinping has cast the die,the most powerful Chinese leader since Mao Zedong aims to prick China's $24 trillion credit bubble soon.
#12 I posted this and shared it with you last week,a significant debt default by a coal company in China and their 2nd largest bank.
#13 Japan's Nikkei stock index has already fallen by 14 percent so far in 2014. That is a massive decline in just a month and a half.
#14 Ukraine continues to fall apart financially... The worsening political and economic circumstances in Ukraine has prompted the Fitch Ratings agency to downgrade Ukrainian debt from B to a pre–default level CCC. This is lower than Greece, and Fitch warns of future financial instability.
#15 The unemployment rate in Australia has risen to the highest level in more than 10 years.
#16 The central bank of India is in a panic over the way that Federal Reserve tapering is effecting their financial system as India economy Meltdown..
#17 The effects of Federal Reserve tapering are also being felt in Thailand... In the wake of the US Federal Reserve tapering, emerging economies with deteriorating macroeconomic figures or visible political instability are being punished by skittish markets. Thailand is drifting towards both these tendencies.
#18 One of Ghana's most prominent economists says that the economy of Ghana will crash by June 2014.
#19 Yet another Power heavy weight banker has mysteriously died during the prime years of his life. That makes five "suspicious banker deaths" in just the past two weeks alone.
#20 The behavior of the U.S. stock market continues to parallel the behavior of the U.S. stock market in 1929. The US has $18 Trillion in debt, increasing at around $1 Trillion pa. plus about $100 Trillion in unfunded liabilities and $270 Trillion in toxic derivatives still floating around out there. That debt can never be repaid and the unfunded liabilities can never be delivered. The US is BROKE. The Gold is long gone and that which remains is leveraged paper, hypothecated, re-hypothecated many times over.

Yes, things don't look good right now, but it is important to keep in mind that this is just the beginning.

This is just the leading edge of the next great financial storm.
The next two years (2014 and 2015) are going to represent a major "turning point" for the global economy. By the end of 2015, things are going to look far different than they do today.

None of the problems that caused the last financial crisis have been fixed. Global debt levels have grown by 30 percent since the last financial crisis, and the too big to fail banks in the United States leverage are 37 percent larger than they were back then and their behavior has become even more reckless than before.

As a result, we are going to get to go through another "2008-style crisis", it is obvious that the next wave is going to be FAR worse than the previous one.

So hold on tight and get ready. We are going to be in for quite a bumpy ride.

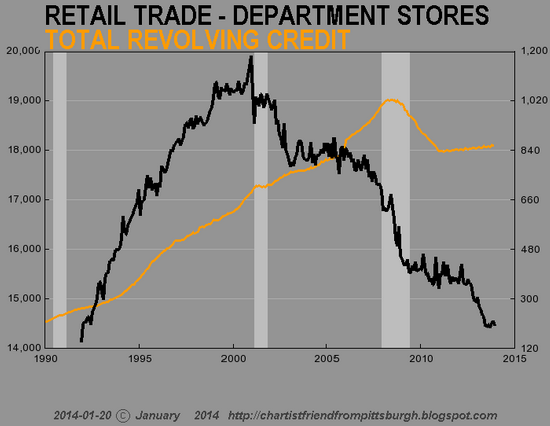
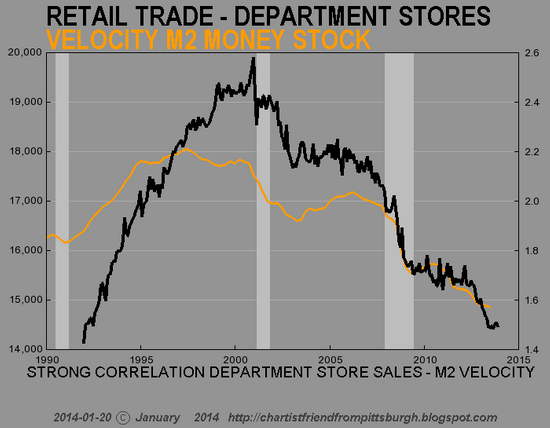
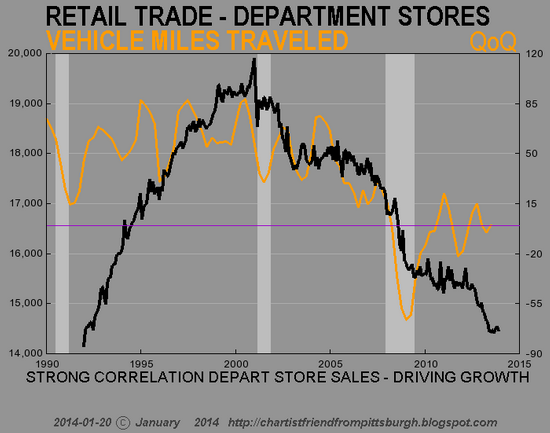
At any rate who gives a rats ass about Oz manufacturing or mining being in decline. Australians can get rich by flipping houses to each other (and the odd clueless Immigrant). There's no housing bubble in Oz - I know this cause the man from the RBA said it, along with every Sydney property owning economist. But most important of all, Michael Yardney (Australia's greatest ever property expert) said it.
— 

Tuesday, January 28, 2014

Most Germans Don't Buy Their Homes, They Rent. Here's Why

It's just a fact. Many Germans can't be bothered to buy a house.

The country's homeownership rate ranks among the lowest in the developed world, and nearly dead last in Europe, though the Swiss rent even more. Here are comparative data from 2004, the last time the OECD updated its numbers. (Fresh comparisons are tough to find, as some countries only publish homeownership rates every few years or so.)
And though those data are old, we know Germany's homeownership rate remains quite low. It was 43% in 2013.
This may seem strange. Isn't home ownership a crucial cog to any healthy economy? Well, as Germany shows—and Gershwin wrote—it ain't necessarily so.
In Spain, around 80% of people live in owner-occupied housing. But unemployment is nearly 27%, thanks to the burst of a giant housing bubble.
Only 43% own their home in Germany, where unemployment is 5.2%.
Of course, none of this actually explains why Germans tend to rent so much. Turns out, Germany's rental-heavy real-estate market goes all the way back to a bit of extremely unpleasant business in the late 1930s and 1940s.
Germany%20Rentals.psd
By the time of Germany's unconditional surrender in May 1945, 20% of Germany's housing stock was rubble. Some 2.25 million homes were gone. Another 2 million were damaged. A 1946 census showed an additional 5.5 million housing units were needed in what would ultimately become West Germany.
Germany's housing wasn't the only thing in tatters. The economy was a heap. Financing was nil and the currency was virtually worthless. (People bartered.) If Germans were going to have places to live, some sort of government program was the only way to build them.
And don't forget, the political situation in post-war Germany was still quite tense. Leaders worried about a re-radicalization of the populace, perhaps even a comeback for fascism. Communism loomed as an even larger threat, with so much unemployment.
West Germany's first housing minister — a former Wehrmacht man by the name of Eberhard Wildermuth — once noted that "the number of communist voters in European countries stands in inverse proportion to the number of housing units per thousand inhabitants."
A housing program would simultaneously put people back to work and reduce the stress of the housing crunch. Because of such political worries — as well as genuine, widespread need — West Germany designed its housing policy to benefit as broad a chunk of the population as possible.
Soon after West Germany was established in 1949, the government pushed through its first housing law. The law was designed to boost construction of houses which, "in terms of their fittings, size and rent are intended and suitable for the broad population."
It worked. Home-building boomed, thanks to a combination of direct subsidies and generous tax exemptions available to public, non-profit and private entities. West Germany chopped its housing shortage in half by 1956. By 1962, the shortage was about 658,000. The vast majority of new housing units were rentals. Why? Because there was little demand from potential buyers. The German mortgage market was incredibly weak and banks required borrowers to plunk down large down payments. Few Germans had enough money.
It's worth noting that Germany wasn't the only country with a housing crisis after World War II. Britain had similar issues. And its government also undertook large-scale spending to promote housing. Yet the British didn't remain renters. The UK homeownership rate is around 66%, much higher than Germany's.
Why? The answer seems to be that Germans kept renting because, in Germany, rental housing is kind of nice....

Monday, January 27, 2014

Terrifying Technicals

Average house prices have surged beyond the £1 million mark in almost 50 areas of the country, with Britain's economic recovery creating a new generation of property millionaires, a study shows.
The report, an authoritative analysis of sale values in England and Wales, identifies 43 locations where houses now sell for an average of more than £1 million, including several outside London.
It highlights how dozens of property hot spots have emerged not just in the South East, but also across the country, with average prices in areas of Buckinghamshire and Oxfordshire reaching more than £900,000.
In parts of Somerset, homes now sell for an average in excess of £800,000, while in several areas of the North and the Midlands, the average sale price is more than £500,000....
*** UK Daily Telegraph / link
S%26P%20Plunge.jpg 
What kind of blowback should we prepare for? The lesson of history is that trying to force things to get better does not merely create unwelcome repercussions. It does not merely slow the pace of natural evolution. Attempts to enforce a certain outcome always appear to create the opposite effect. We do not find a law of adverse consequences. We find a law of opposite impacts.
Let us review the sample examples from the previous charts. Every effort to jam an ideology or a plan down the throat of the world only creates the opposite of the intended effect. I would maintain that this is one of the few lessons from history that can be relied on.
If the Federal Reserve is trying to force feed us prosperity then the inevitable blowback will be adversity. If the Fed is trying to compel the most dramatic economic recovery in history, then the blowback may well be the deepest depression in history. If the Fed is trying to enforce confidence and optimism then the blowback will be fear and despair. If the Fed is trying to force consumers to spend then the blowback will be a collapse in consumer confidence.
I sincerely hope that I am completely wrong here, that I am missing something, that there is a flaw in my logic. However until I can locate such a flaw I must trust the technical case for treating this Fed force-fed rally in the stock market as something that will end badly.
Here's how it plays out....
*** Walter Zimmerman (via Zerohedge) / link
At the top, the only 3 countries in the world that DON'T use the metric system.
At the bottom, the only 22 countries in the world that the British haven't, at one time or another, invaded.
These two maps were plucked from 40 that will change how you see the world.
Fascinating stuff.
*** A sheep no more / link
Maps.psd 
Source: asheepnomore.com


Saturday, January 25, 2014

U.S.Retail-CRE The First Domino to Fall:

The domino of retail CRE will not fall in isolation; it will topple the domino of debt next to it.

That the retail trade is stagnating has been well-established: for exampleThe Retail Death Rattle (The Burning Platform).
Equally well-established is the vulnerability of the bricks-n-mortar commercial real estate sector to this downturn: further analysis by Mark G. makes the case:After Seven Lean Years, Part 2: US Commercial Real Estate: The Present Position and Future Prospects.
I’d like to extend Mark’s excellent analysis a bit because it suggests that the retail CRE (commercial real estate) sector will likely be the first domino to fall in the next financial crisis–the one we all know is brewing.
Let’s start with two charts of retail that I have marked up: the first is a chart of retail traffic from The Burning Platform story above. Note the phenomenal building boom in retail space from 2000 to 2008: nine straight years of adding about 300 million square feet of retail space each year.

The second chart shows department store sales, which fell by 15% during the retail building boom.

It might be possible to argue that this additional 2.7 billion square feet of retail space was needed as competitors ate the department store chains’ lunches, but let’s start by considering the foundation of retail sales: consumer income and credit.
One way to measure income to adjust it for inflation (i.e. real income) and measure it per person (per capita) on a year-over-year (YoY) basis. Notice how real income per capita has absolutely cratered in the “too big to fail” quantitative easing (QE) era masterminded by the Federal Reserve: if this is success, I’d hate to see failure.

Another way to measure median household income:

There’s a big problem with per capita (and mean or average) measures of income: a significant gain in the the top 10%’s income will mask the decline in the bottom 90%’s income. If households earning $150,000 annually get a boost to $200,000, that $50,000 increase not only offsets the decline of nine households who saw their income decline from $35,000 to $31,500 annually, but pushes both the per capita income metrics higher even as 9 of 10 households experienced a 10% decline in income.
The point here is that the declines are far deeper for the bottom 90% than shown on the per capita chart, as the top 10%’s increase in income has skewed per capita income higher. We can see this clearly in this chart:

Notice how the income of the top 10% diverged from the bottom 90% once the era of financialization and asset bubbles started in the early 1980s. Each asset bubble–housing in the late 1980s, tech in the 1990s and housing again in the 2000s–nudged the incomes of the bottom 90% briefly into marginally positive territory while it spiked the incomes of the top 10% into the stratosphere.
There are only two ways households can buy stuff: with income or credit/debt, as in charging purchases on credit cards. We’ve seen that income has tanked for the bottom 90%; how about credit/debt?
Courtesy of Chartist Friend from Pittsburgh, we can see that revolving consumer credit has flatlined:

There’s another component to the erosion of bricks-n-mortar and the ascent of eCommerce, as Chartist Friend from Pittsburgh explains:
This M2 (money) velocity chart is better because it reminds us of the days when you would drive to the mall to make a purchase, and while you were there you’d stop at the food court to have lunch, and then maybe you’d walk around afterwards and see some other item you wanted to buy, or run into friends and decide to catch a movie or have a drink, etc. At the mall there are lots of ways for money to change hands – online not so much.

Fewer trips to the mall (correlated to maxed out credit cards, declining real disposable income and the ease of online shopping) also translates into fewer miles driven and fewer gallons of gasoline purchased:

All this boils down to one simple question: can the top 10% (roughly 11 million households) support the billions of square feet of retail space that were added in the 2000s? If the answer is no, as it clearly is, then the retail CRE sector is doomed to implode.
Let’s try a second simple question: what’s holding the retail CRE sector up?Answer: leases that will soon expire or be voided by insolvency, bankruptcy, etc. as retailers close stores and shutter their businesses.
One last question: who’s holding all the immense debt that’s piled on top of this soon-to-collapse sector? The domino of retail CRE will not fall in isolation; it will topple the domino of debt next to it, and that will topple the lenders who are bankrupted by the implosion of retail-CRE debt. And once that domino falls, it will take what’s left of the nation’s illusory financial stability down with it.

The First Domino to Fall: Retail-CRE (Commercial Real Estate)

The domino of retail CRE will not fall in isolation; it will topple the domino of debt next to it.
That the retail trade is stagnating has been well-established: for exampleThe Retail Death Rattle (The Burning Platform).
Equally well-established is the vulnerability of the bricks-n-mortar commercial real estate sector to this downturn: yesterday’s analysis by Mark G. makes the case:After Seven Lean Years, Part 2: US Commercial Real Estate: The Present Position and Future Prospects.
I’d like to extend Mark’s excellent analysis a bit because it suggests that the retail CRE (commercial real estate) sector will likely be the first domino to fall in the next financial crisis–the one we all know is brewing.
Let’s start with two charts of retail that I have marked up: the first is a chart of retail traffic from The Burning Platform story above. Note the phenomenal building boom in retail space from 2000 to 2008: nine straight years of adding about 300 million square feet of retail space each year.

The second chart shows department store sales, which fell by 15% during the retail building boom.

It might be possible to argue that this additional 2.7 billion square feet of retail space was needed as competitors ate the department store chains’ lunches, but let’s start by considering the foundation of retail sales: consumer income and credit.
One way to measure income to adjust it for inflation (i.e. real income) and measure it per person (per capita) on a year-over-year (YoY) basis. Notice how real income per capita has absolutely cratered in the “too big to fail” quantitative easing (QE) era masterminded by the Federal Reserve: if this is success, I’d hate to see failure.

Another way to measure median household income:

There’s a big problem with per capita (and mean or average) measures of income: a significant gain in the the top 10%’s income will mask the decline in the bottom 90%’s income. If households earning $150,000 annually get a boost to $200,000, that $50,000 increase not only offsets the decline of nine households who saw their income decline from $35,000 to $31,500 annually, but pushes both the per capita income metrics higher even as 9 of 10 households experienced a 10% decline in income.
The point here is that the declines are far deeper for the bottom 90% than shown on the per capita chart, as the top 10%’s increase in income has skewed per capita income higher. We can see this clearly in this chart:

Notice how the income of the top 10% diverged from the bottom 90% once the era of financialization and asset bubbles started in the early 1980s. Each asset bubble–housing in the late 1980s, tech in the 1990s and housing again in the 2000s–nudged the incomes of the bottom 90% briefly into marginally positive territory while it spiked the incomes of the top 10% into the stratosphere.
There are only two ways households can buy stuff: with income or credit/debt, as in charging purchases on credit cards. We’ve seen that income has tanked for the bottom 90%; how about credit/debt?
Courtesy of Chartist Friend from Pittsburgh, we can see that revolving consumer credit has flatlined:

There’s another component to the erosion of bricks-n-mortar and the ascent of eCommerce, as Chartist Friend from Pittsburgh explains:
This M2 (money) velocity chart is better because it reminds us of the days when you would drive to the mall to make a purchase, and while you were there you’d stop at the food court to have lunch, and then maybe you’d walk around afterwards and see some other item you wanted to buy, or run into friends and decide to catch a movie or have a drink, etc. At the mall there are lots of ways for money to change hands – online not so much.

Fewer trips to the mall (correlated to maxed out credit cards, declining real disposable income and the ease of online shopping) also translates into fewer miles driven and fewer gallons of gasoline purchased:

All this boils down to one simple question: can the top 10% (roughly 11 million households) support the billions of square feet of retail space that were added in the 2000s? If the answer is no, as it clearly is, then the retail CRE sector is doomed to implode.
Let’s try a second simple question: what’s holding the retail CRE sector up?Answer: leases that will soon expire or be voided by insolvency, bankruptcy, etc. as retailers close stores and shutter their businesses.
One last question: who’s holding all the immense debt that’s piled on top of this soon-to-collapse sector? The domino of retail CRE will not fall in isolation; it will topple the domino of debt next to it, and that will topple the lenders who are bankrupted by the implosion of retail-CRE debt. And once that domino falls, it will take what’s left of the nation’s illusory financial stability down with it.

Read more at http://www.maxkeiser.com/2014/01/the-first-domino-to-fall-retail-cre-commercial-real-estate/#KmJyxH0Et5R77Pyu.99

Wednesday, January 22, 2014

US Retail-CRE The First Domino to Fall

The First Domino to Fall: Retail-CRE (Commercial Real Estate)

The domino of retail CRE will not fall in isolation; it will topple the domino of debt next to it.
That the retail trade is stagnating has been well-established: for example, The Retail Death Rattle (The Burning Platform).
Equally well-established is the vulnerability of the bricks-n-mortar commercial real estate sector to this downturn: yesterday’s analysis by Mark G. makes the case:After Seven Lean Years, Part 2: US Commercial Real Estate: The Present Position and Future Prospects.
I’d like to extend Mark’s excellent analysis a bit because it suggests that the retail CRE (commercial real estate) sector will likely be the first domino to fall in the next financial crisis–the one we all know is brewing.
Let’s start with two charts of retail that I have marked up: the first is a chart of retail traffic from The Burning Platform story above. Note the phenomenal building boom in retail space from 2000 to 2008: nine straight years of adding about 300 million square feet of retail space each year.

The second chart shows department store sales, which fell by 15% during the retail building boom.

It might be possible to argue that this additional 2.7 billion square feet of retail space was needed as competitors ate the department store chains’ lunches, but let’s start by considering the foundation of retail sales: consumer income and credit.
One way to measure income to adjust it for inflation (i.e. real income) and measure it per person (per capita) on a year-over-year (YoY) basis. Notice how real income per capita has absolutely cratered in the “too big to fail” quantitative easing (QE) era masterminded by the Federal Reserve: if this is success, I’d hate to see failure.

Another way to measure median household income:

There’s a big problem with per capita (and mean or average) measures of income: a significant gain in the the top 10%’s income will mask the decline in the bottom 90%’s income. If households earning $150,000 annually get a boost to $200,000, that $50,000 increase not only offsets the decline of nine households who saw their income decline from $35,000 to $31,500 annually, but pushes both the per capita income metrics higher even as 9 of 10 households experienced a 10% decline in income.
The point here is that the declines are far deeper for the bottom 90% than shown on the per capita chart, as the top 10%’s increase in income has skewed per capita income higher. We can see this clearly in this chart:

Notice how the income of the top 10% diverged from the bottom 90% once the era of financialization and asset bubbles started in the early 1980s. Each asset bubble–housing in the late 1980s, tech in the 1990s and housing again in the 2000s–nudged the incomes of the bottom 90% briefly into marginally positive territory while it spiked the incomes of the top 10% into the stratosphere.
There are only two ways households can buy stuff: with income or credit/debt, as in charging purchases on credit cards. We’ve seen that income has tanked for the bottom 90%; how about credit/debt?
Courtesy of Chartist Friend from Pittsburgh, we can see that revolving consumer credit has flatlined:

There’s another component to the erosion of bricks-n-mortar and the ascent of eCommerce, as Chartist Friend from Pittsburgh explains:
This M2 (money) velocity chart is better because it reminds us of the days when you would drive to the mall to make a purchase, and while you were there you’d stop at the food court to have lunch, and then maybe you’d walk around afterwards and see some other item you wanted to buy, or run into friends and decide to catch a movie or have a drink, etc. At the mall there are lots of ways for money to change hands – online not so much.

Fewer trips to the mall (correlated to maxed out credit cards, declining real disposable income and the ease of online shopping) also translates into fewer miles driven and fewer gallons of gasoline purchased:

All this boils down to one simple question: can the top 10% (roughly 11 million households) support the billions of square feet of retail space that were added in the 2000s? If the answer is no, as it clearly is, then the retail CRE sector is doomed to implode.
Let’s try a second simple question: what’s holding the retail CRE sector up?Answer: leases that will soon expire or be voided by insolvency, bankruptcy, etc. as retailers close stores and shutter their businesses.
One last question: who’s holding all the immense debt that’s piled on top of this soon-to-collapse sector? The domino of retail CRE will not fall in isolation; it will topple the domino of debt next to it, and that will topple the lenders who are bankrupted by the implosion of retail-CRE debt. And once that domino falls, it will take what’s left of the nation’s illusory financial stability down with it.

Read more at http://www.maxkeiser.com/2014/01/the-first-domino-to-fall-retail-cre-commercial-real-estate/#CrqHUwoGCJgkkM7G.99

Thursday, December 19, 2013

Economy of Japan

The economy of Japan is the third largest in the world by nominal GDP the fourth largest by Purchasing Power Parity and is the world's second largest Purchasing Power Parity According to the International Monetary Fund the country's per capita GDP (PPP) was at $35,855 or the 22nd highest in 2012. Japan is a member of Group of Eight. The Japanese economy is forecasted by the Quarterly Tankan survey of business sentiment conducted by the Bank of Japan.
Japan is the world's 3rd largest automobile manufacturing country, has the largest electronics goods industry, and is often ranked among the world's most innovative countries leading several measures of global patent filings. Facing increasing competition from China and South Korea, manufacturing in Japan today now focuses primarily on high-tech and precision goods, such as optical instruments, Hybrid vehicles, and robotics.. Beside the Kanto region, the Kansai region is one the leading industrial clusters and the manufacturing center for the Japanese economy.
Japan is the world's largest creditor nation, generally running an annual trade surplus and having a considerable net international investment surplus. As of 2010, Japan possesses 13.7% of the world's private financial assets (the 2nd largest world) at an estimated $14.6 trillion. As of 2013, 62 of the Fortune Globle 500 companies are based in Japan.
Overview of economy: In the three decades following 1960, Japan ignored defense spending in favor of economic growth, thus allowing for a rapid economic growth referred to as the Japanese post-war economic miracle. By the guidance of Ministry of Economy, Trade and Industry, with average growth rates of 10% in the 1960s, 5% in the 1970s, and 4% in the 1980s, Japan was able to establish and maintain itself as the world's second largest economy from 1978 until 2010, when it was supplanted by the People's Republic of Japan. By 1990, income per capital in Japan equalled or surpassed that in most countries in the West.
However, in the second half of the 1980s, rising stock and real estate prices caused the Japanese economy to overheat in what was later to be known as the Japanes asset price bubble caused by the policy of low interest rate by Bank of Japan. The economics Bubble came to an abrupt end as the Tokyo Stock Exchange crashed in 1990–92 and real estate prices peaked in 1991. 
Growth in Japan throughout the 1990s at 1.5% was slower than growth in other major developed economies, giving rise to the term Lost Decates. Nonetheless, GDP per capita growth from 2001-2010 has still managed to outpace Europe and the United States. 
But Japan Public-Dept remains a daunting task for the Japanese government due to excessive borrowing, social welfare spending with an aging society and lack of economic/industrial growth in recent days to contribute to the tax revenue. Japan had recently embraced the new strategy of economic growth with such goals to be achieved in 2020 as expected. The modern ICT industry has generated one of the major outputs to the Japanese economy. Japan is the second largest music market in the world (for more, see Japan Hot 100). With fewer children in the aging Japan, Japanese Anime industry is facing growing Chinese competition in the targeted Chinese market. Japanese Manga industry enjoys popularity in most of the Asian markets.
Although many kinds of minerals were extracted throughout the country, most mineral resources had to be imported in the postwar era. Local deposits of metal-bearing ores were difficult to process because they were low grade. The nation's large and varied forest resources, which covered 70 percent of the country in the late 1980s, were not utilized extensively. Because of political decisions on local, prefectural, and national levels, Japan decided not to exploit its forest resources for economic gain. Domestic sources only supplied between 25 and 30 percent of the nation's timber needs. 
Agriculture and fishing were the best developed resources, but only through years of painstaking investment and toil. The nation therefore built up the manufacturing and processing industries to convert raw materials imported from abroad. This strategy of economic development necessitated the establishment of a strong economic infrastructure to provide the needed energy, transportation, communications, and technological know-how.
Deposits of gold, Magnesium, and silver meet current industrial demands, but Japan is dependent on foreign sources for many of the minerals essential to modern industry. Iron ore, copper, bauxite and alumina must be imported, as well as many forest products.

Thursday, December 12, 2013

Tokyo Real Estate Value comparison with Foreign Cites

Tokyo Real Estate Value comparison with Foreign Cites 

The attractiveness of Tokyo real estate
Over the past nearly 2 decades after the bubble economy collapsed, Japan had been experiencing deflationary and poor economic conditions. But the economy has begun to pick up due to Abenomics, the first economic policy of Abe government. Since then, Japanese real estate has been attracting attention from overseas investors.
The key factor affecting this phenomenon is a progress of yen depreciation triggered by the easy monetary policy from Bank of Japan. Yen rate which was  around 80yen/USD is now depreciating to nearly 100 yen/USD. The acquisition cost is now becoming lower, which is relatively attractive for overseas real estate investors. The Tokyo real estate, in particular, is attractive for its resistance to earthquake, safety, city power, and the quality of buildings such as interior decoration.
In this article, value of real estate in Tokyo will be discussed from the viewpoints of profitability, quality, and city power as compared to overseas real estate.

1. Profitability
The income of property investments is divided into two components: (1) cash inflow from monthly rent revenue and (2) capital gain/loss, the difference between the acquisition cost and the sale price of the property. Due to the maturity of Japanese real estate market, real estate prices are relatively stable in Japan compared to overseas market. Because of prolonged deflationary economy and fewer foreign capital inflows, Japanese real estate prices fluctuated within a small range over the past several years. The opposite situation can be seen in Hong Kong, a high risk/high return market, where foreign capital flew in looking for higher returns in its volatile market. Although we cannot expect large appreciation of real estate price in Tokyo, we do not expect its depreciation either.
The stability of profitability comes from stable income gains by rent revenue. For example, annual yield of rent revenue in Hong Kong is 2.5%~2.8%, whereas it is close to 4% in Tokyo.
As there are politically unstable countries in Asia, wealthy people prefer city of Tokyo which offers a politically stable environment for the purpose of risk diversification. New York city has little room for development, thus the transactions are very limited at present. London is popular as a good investment location for its stable income gain since it’s difficult to change rent. However, taxation was strengthened in March, 2012 — 7% of stamp tax was imposed at the time of acquisition for properties for the amount of more than 2 million pounds. Taxation is strengthened in Singapore as well to curb a sharp increase in housing prices.
On the other hand, the Japanese real estate transaction is not highly regulated nor subject to special taxation on overseas investors which is very appealing for foreigners.  As such, real estate in Tokyo is very attractive as it generates a high return from a stable income revenue instead of a capital gain due to low volatility of real estate prices.

2, Quality
Japanese real estate stands at the highest level in the world in terms of resistance to earthquake, disaster prevention, security and so on. The global earthquake-resistant standard is that buildings will be uncollapsible when earthquakes occurs. Since Japan is subject to frequent earthquakes, the buildings are designed to minimize rolling in addition to avoid collapsing.
Japanese style interior decoration has a big freedom of the layout, and a high value is set at the facilities of the kitchen as compared to other Asian countries where the eating out culture develops, and a bathroom facility is in the world highest level as well.
Although Japanese real estate is inferior to European and American ones from energy conservation perspective, the quality of Japanese real estate stands out among all.

3. City power
According to world aggregate city ranking in “Global Power City Index, 2012 edition ,” Tokyo is ranked at the fourth place in the world in terms of city power next to London, New York, and Paris, and, above all, is ranked at the first place in terms of living environment and working environment. It stands at the world top level in the field of economy and environment. Tokyo has a well maintained transportation network and good distribution of a large number of convenience stores which produce comfortable living environment. Because of that, the number of Michelin star restaurant in Tokyo is 243 exceeding Paris of 73 restaurants by more than three times (by “the Michelin Guide” of each city). These are the evidence of Tokyo’s high quality of dining culture and environment.
In addition, Tokyo becomes the world’s best working place in terms of the amount of income paid, accumulation of the companies, the numbers of employment opportunities, and low unemployment rate. It is certain that these factors will contribute favorably to the value of Tokyo. Furthermore, we can anticipate further improvement of city power by the developments of infrastructure, the enlargement/enhancement of housing and amusement facilities given the decision of Tokyo Olympics to be held in 2020.

4. Volumes Swell
The volume of real estate transactions in Tokyo jumped 58 percent to $15.6 billion in the first nine months of this year, according to a report by Jones Lang LaSalle Inc. That’s $400 million short of New York, which ranked second with $16 billion after a 16 percent decline. Paris was fourth with $10.9 billion, while London topped the list with $23.2 billion.
Tokyo’s office vacancy rate, a measurement of unoccupied space, dropped to 7.56 percent last month from 7.9 percent in September and was at its lowest since June 2009, according to broker Miki Shoji Co. The gauge reached a record 9.43 percent in June 2012.
Commercial land values in Japan’s three biggest metropolitan areas rose for the first time since 2008 this year, gaining 0.6 percent, according to the land ministry’s annual land survey report released in September.

5. Spreads 
The spread on the Tokyo-based Real Estate being very good due to Japan having the lowest interest rates globally while enjoying solid yields from rental income.

“The overall office market is improving at a faster than anticipated rate which is very positive for the REIT market,” “We refinanced the debt earlier because we see now as a good timing.”
Abe’s economic stimulus campaign includes monetary stimulus to encourage finance activity. Stepped-up borrowing by Japanese companies has to translate into increased capital spending for the measures to succeed in ending deflation and reviving the world’s third-largest economy.

Summary
Tokyo real estate is characterized by a stable and profitable income gain, strong resistance of buildings to earthquake, well designed of disaster prevention, good security and so on. In terms of city power,the economic condition and living environment, Tokyo is ranked in the world top place.
Given these facts, it would be obvious that real estate in Tokyo is very attractive. Japanese real estate is certainly the best choice in future investments.

Abe's Policies Felt Big In Commercial Real Estate

Abe's Policies Felt Big In Commercial Real Estate

TOKYO (Nikkei)--The term Abenomic's has been coined by economic pundits to describe the potential result of Prime Minister Shinzo Abe's expansionary economic policies: Asset Bubble Economics, or "ABE."

Abe's penchant for policies that risk creating asset bubbles was already noticeable during his first time as prime minister in 2006.

When it was certain that he would be coming back as prime minister, the Japanese stock market responded with a rally. Real estate markets are beginning to explode again like it was in the 1980's, as investors are flooding it to capitalize on the effects of  Abenomics on asset prices.

Larger Impact

The Liberal Democratic Party's return to power landslide lower house victory happened just when the real estate market was emerging from the "2012 problem," a much-feared glut in the office building market caused by so many new office towers going up in 2012. Office rents had started showing signs of bottoming out.

True to his economic policy agenda, marked by huge public spending and aggressive monetary easing, Abe quickly clinched a deal with the Bank of Japan to set a formal inflation target of 2%.

Experts are pointing out that even this modest amount of inflation could trigger a steep upswing in property prices, which tend to fluctuate far more wildly than consumer prices.

"When consumer prices rise 2%, land prices grow 50%," says Toji Akamura, a senior analyst in charge of the property market real estate Securities. in Tokyo.

Major Districts of Tokyo earmarked to Major Redevelopments completed before 2020 Olympics

Major Districts of Tokyo earmarked to Major Redevelopments completed before 2020 Olympics


Tokyo will hold the Olympic games in 2020, and each district in Tokyo will be redeveloped to make them more attractive. This article highlights the redevelopment activities in five popular districts in Tokyo.

1. Shinjuku
Shinjuku station is an important interchange in Tokyo as it lies at the crossroads of major railway lines operated by five railway companies: JR East, Keio, Odakyu, Tokyo Metro, and the Tokyo Metropolitan Government Traffic Bureau. In addition, it is also lies at the heart of the amusement and nightlife district. According to the Guinness World Records, Shinjuku Station is the world’s busiest station that serves an average of 3.64 million passengers per day!
The area surrounding Shinjuku Station is well developed, however the rows of commercial facilities on both the east and west sides of the station have been blamed for terrible congestion and traffic jams in the area.
In response to the traffic congestion, an air space over the south entrance/exit of the Shinjuku Station is currently being constructed: a huge ground will be constructed over the station facilities, and a wide variety of buildings and facilities, as well as pedestrian squares, taxi stands, and long-distance bus stops will be erected on the ground In addition, “New Shinjuku Station South Entrance Building,” a new landmark is being erected on the south side of the Shinjuku Station; scheduled for completion in 2016, this new building will accommodate office, commerce, and cultural facilities.
As many people are moving to the areas around terminal stations such as the Shinjuku Station, development and redevelopment activities are often undertaken around these stations to make full use of the land and air spaces in these prime locations.

2. Marunouichi and Otemachi
Marunouchi is a busy business district that has morphed into an attractive shopping destination as well. While the number of passengers who use the Marunouchi Station has not reached its full potential, Marunouchi will certainly grow as Mitsubishi Estate Co., Ltd. will be developing the Marunouchi district where they own lot of land. In addition, Tokyo Station, which is close to the Marunouchi Station and the Otemachi Station, is also capable of accommodating a large number of commuters.
The Otemachi Station serves five subway lines and also provides good traffic access. The area around the station is also concentrated with the headquarters of many financial, insurance, information/communication, and media companies.
Otemachi is unique as there is a big gap in the number of people in the district during the day and night: while approximately 72,000 people work there during the day, there are no registered residents living there at night. The area functions just as an office town and thus no residential environment improvement plan exists. Following the approval of “Type 1 City Redevelopment Project at Otemachi 2 Chome” in August 2013, many old buildings and parking lots will be repaired in due time.

3. Shibuya
The Shibuya Station is another big terminal station like the Shinjuku Station. The district of Shibuya has traditionally been youth centric, but it has also been attracting people in their 30-40s since Shibuya Hikarie, a large commercial facility, opened in April 2012. With the commencement of the Fuku-Toshinsen and Tokyu Toyokosen railway lines, Shibuya is part of a wide railway network that stretches from Saitama and Yokohama. In 2013, the Tokyo Metropolitan Government approved three urban projects: “Station Commercial District Development Plan,” “Dogenzaka Redevelopment Plan,” and “Shibuya Station South District Development Project.” These three projects call for the development of more commercial facilities and offices; the increase and improvement of parking lots, pedestrian decks and limousine bus terminals; and the use of design architects for the design of pedestrian squares and low levels of buildings.

4. Nihonbashi
As the Bank of Japan is headquartered at Nihonbashi, it is widely thought to be a representative financial district in Japan. Erected in 2004, COREDO (which is the combination of the words Core and Edo) Building erected at the Nihonbashi intercourse in 2004, was named in hope that Nihonbashi will regain its role as the commercial center of Tokyo today, just as it was in Edo eons ago.
Yaesu is a neighboring district of Nihonbashi; unlike Marunouchi, Yaesu has not seen much redevelopment in recent times, hence, people getting off at the Tokyo Station, are more likely to visit the Marunouchi side,not the Yaesu side. If Yaesu, the opposite side of Marunouchi, is redeveloped nicely, it will increase the footfall to Nihonbashi too.

5. Haneda International Airport
Compared to many other airports in the world, access to the Haneda Airport from the city center is very good. In addition, the short distance between the railway stations and airport check-in counters is another advantage that has often been cited. Following the construction of a fourth runway in 2010, and improved access to foreign countries, the number of international flights is expected to increase by 50 percent to reach 86 flights a day by the spring of 2014.
Due to the limited number of landing slots at Haneda, most international flights have been using the Narita International Airport despite its inferior traffic access. However, in recent years, Japan has been actively developing Haneda Airport into an airport hub. If the Haneda Airport, is developed further as an international airport, the number of visitors to Tokyo will increase. Before investing in real estate, one should not only focus on the property that one intends to buy, but should also take into consideration the development plans and potential growth of the areas surrounding the property.
6. Hiyoshi 
Hiyoshi is a part of the city of Yokohama, Kanagawa Prefecture, Japan. It is located within Kōhoku Ward in the northeast of Yokohama City.
It is served by Hiyoshi Station on the Tōkyū Tōyoko Line and Yokohama Subway. It is approximately 22 minutes by train from Shibuya, and 15 minutes from Yokohama, being located between Moto-Sumiyoshi on the north and Tsunashima on the south. Both the Express and Commuter Limited Express services stop at Hiyoshi.
Hiyoshi is the home of Keio University's Hiyoshi campus, Yagami campus and Keio Business School. The main part of Hiyoshi Campus is located directly to the right of the station exit across Tsunashima Kaidō. The campus sprawls over a low hill and is most remarkable for the many tall trees growing there. Yagami campus, located only a short walk from Hiyoshi campus, holds the faculty of Science and Technology.
The town shopping district is on the opposite side of the station, the west side with includes a very dynamic and cosmopolitan precinct filled with a huge variety of fantastic restaurants and shops making Hiyoshi a highly sort after location to live. The town's main thoroughfares run out from the station's Nishiguchi Square like the spokes of a wheel, though the direction of traffic is generally toward the station. Sun Road runs north (traffic south). Hamagin Dōri runs northwest. Chūō Dōri runs out to the west (traffic east). And, Futsubu Dōri comes in toward the station from the southwest. Hiyoshi is one of the most affluent suburbs in Tokyo and Yokohama.

Japans Economy Derived from 2020 Olympics

Japans Economy Derived from 2020 Olympics
“Tokyo to host 2020 Olympics” has been the hottest headline in Japan. Prior to the bid, Madrid and Spain were expected to have better advantages of being chosen to host 2020 Olympics. Surprisingly, Tokyo stood out in the competition – five interlocking rings will arrive Japan in 2020.
It has been a long-cherished wish of the Tokyo metropolitan government and related industries in Japan to host the Olympic games, and the Olympics fever has wide spreaded on the locals. Hosting 2020 Olympics in Japan is not just a dream-come-true, it is paving a road to tremendous economic opportunities. Without a doubt, financial and investment industry is cheering for the news too.

◉ Attractive Projects Derived From the Olympics 1: Improvement of Infrastructure
The stock price of major general construction companies, such as Shimizu Corporation and Taisei Corporation, reached their highest values for the year in August. Investors are also showing their more-than-ever interest on the related projects.
The Tokyo metropolitan government had already determined to develop and improve athletic facilities for events such as swimming, volleyball, and badminton around Tokyo Bay if Tokyo were to host summer Olympics in 2020.  Now the metropolitan government plans to invest additional 130 billion yen, including the improvement on Shinkansen (Bullet train) tracks in Tokyo and a new Tokyo Gaikan Expressway( has started and will be finished by 2020.) The development of logistical infrastructure, such as roads to connect the Harumi area and inner city, are actively taking place.

◉Attractive Projects Derived From the Olympics 2: A Good Shot to End Deflation
It has been 56 years since last time Tokyo hosted a summer Olympics. The economy was active and prosperous for a good period of time. The 2020 Olympics is likely to and is expect to stimulate the economy, just like it did 56 years ago – win the bid to host Olympics, upward  demands for construction, salary increase then deflation ends. It is estimated that hosting the summer Olympics in 2020 would bring economic effects of 37.9 billion yen to Tokyo and create 152,000 jobs. To Japan, this huge income is more than just a good economic shot.

Attractive Projects Derived From the Olympics 3: Overseas Visitors
Olympics athletics, families, reporters and sports fans all over the world will gather in Tokyo. The demands for public transportation connecting city to the airports are likely to increase. Department sales and profit are expected to rise too.

Risks to the Olympic Projects
According to the estimates from Olympics and Paralympics Bidding Committee, the resulted Olympics-economic effects for Japan will be approximately 7 trillion yen from building construction and the increase of land value by the 2020. Other the other hand, this is only an annual 0.3% GDP increase for 7 years which is considered a limited improvement.  In addition, the positive impacts on stock value will vary by industry -  caution should be taken while investing in the non-infrastructure related and non-real-estate related business.

Economic Effects on the Olympics
What makes it attractive to host the games? To promote the national dignity and to be an attribute for the country, though there are criticisms as the bidding for Olympics costs a significant amount of money.  Followings are the resulted numbers from past events:

1. Tokyo Olympic (1964)
The 18th Summer Olympics was held in Tokyo, Japan on October 10th, 1964. It was the first time Olympics came to Asia. This event also delivered an important message to the world: Japan had recovered from World WarⅡ. It was a national project involving approximately 28.1 billion yen.
The Tokyo Olympics also created an opportunity for Japan to join the Organization for Economic Co-operation and Development (OECD). A huge amount of fund was invested in the athletic facilities and the traffic network in Japan. To keep tack of game process, the demand of mobile TV went up. The sales of color televisions also increased. This positive effect from Olympics was known as “Olympic economic boom.”

2. Beijing Olympics (2008)
It was reported that China also had an Olympic economic boom from Beijing Olympics. According to the preliminary study by Nomura Securities Co., Ltd., during year 2002 to 2008, the Olympics generated 960 billion yuan to China (approximately 14.9 trillion yen) –  308.1 billion yuan (approximately 4.8 trillion yen) and 308.1 billion yuan (approximately 4.8 trillion yen) from direct economic and indirect economic effects, respectively.
The development of athletic facilities in China, construction of basic facilities and increase of visitors brought more than seven times economic effects than Athens Olympics did.
Furthermore, according to the Beijing Olympic Economy Research Association, total direct income during the Beijing Olympics was approximately 2 billion US dollars (212.3 billion yen). Based on China Statistical Information Network and Bureau of Statistics of Beijing, the annual average growth rate of GDP in Beijing was 11.8% from 2005 to 2008, the so-called “Olympics Input,” and was 0.8% higher than the “11th Five-year Plan.”

3. London Olympics (2012)
In July 2013, the British government announced that the 2012 London Olympics generated 99 billion GBP (approximately 1.5 trillion yen) to the country. This was more than the cost of hosting, 89.2 billion GBP (approximately 1.3 trillion yen).
Above figures also include total amount from new contracts of companies, the increase in sales and new investment from overseas one year after the Olympics.
However, some analyses on targeted projects indicate that the figures were inflated to be appealing.

The Major Investors in the Japanese CRE Market as at December 2013

 The Major Investors in the Japanese CRE Market as at December 2013


Over the past year, we have seen clear signs of a recovery in the global real estate investment market. Global investment in commercial real estate exceeded $100 billion in 4Q of 2010, and jumped to $147 billion in 4Q of 2012.
This increased activity in global property significantly affects the Japan domestic real estate market. At this time, we would like to elaborate on the main players who support the Japan real estate market.
Booming real estate market, fuelled in part by lack of supply
Before expanding on the main players in the Japanese real estate market, lets see briefly the real estate market in the Tokyo metropolitan area.
First of all, there is limited supply. The reason is simple. Many new development projects were frozen after the global financial crisis of 2008. After most of these projects were completed in 2012, the pipeline of new projects has shrunk significantly.
In addition, even though it has been more than 20 years since the collapse of the Japanese asset bubble, property prices then were so high that if a property purchased in 1989 were to be sold today, it would still likely crystallise a significant loss.
Moreover, because banks are not always keen to finance real estate investments, investors will typically sell and cash out quickly when they can make just a small profit. As a result, blue-chip suburbs in the Tokyo metropolitan area have been owned by major real estate companies and their related REITs for a very long time.
Main player #1 who support the growing interest in Tokyo real estate: foreign-affiliated funds and banks
When the mini-bubble economy burst in 2008, foreign funds bought many landmark properties in the Tokyo area, investing JPY ¥100B (USD$1B). Although foreign fund managers are still keen to invest further, the supply is limited.
As a result, some foreign fund managers are now looking to invest in condominiums, hotels and industrial facilities in other major Japanese regional cities such as Osaka and Fukuoka.
Although foreign-affiliated funds and banks are not able to invest as much as they would have hoped to so far in Japanese real estate, foreign interest in the Japanese real estate market is not a recent phenomenon . For example, Goldman Sachs has started reinvesting in Japanese real estate since May 2012, to the tune of JPY ¥400B (USD$4B) in the past 3-4 years. Moreover, in June 2012, American fund manager Fortress Investment Group LLC announced that they would increase their investment in Japanese real estate to JPY ¥80 billion (USD$800M) in 2012.
Foreign-affiliated funds and banks are keen to increase exposure to Japanese real estate because many Japanese companies moved offices between 2011 to 2012. Since the Great East Japan Earthquake of 2011, demand for office space that are newer, sturdier, and more able to withstand earthquakes has grown – and is projected to continue to grow.
On the other hand, since the supply of new office space is projected to be very limited from 2013 onwards, it appears likely that rental yields for Japanese office space should increase in the near future, especially in the Tokyo metropolitan area.
Main player #2 who support the growing interest in Japanese real estate: J-REIT ( ‘REIT’ is the acronym for “Real Estate Investment Trust” and ‘J-REITs” invest only in Japanese real estate)
REITs are publicly listed Investment Trusts which invest only in Real Estate. Several years ago, the major buyers in Japan domestic real estate market were corporations-developers and foreign-affiliated funds. But now the domestic REIT is the biggest player in the real estate space. Some foreign investors participate in Japanese real estate through J-REITs.
In the past, major backers of J-REITs were mainly domestic high-net worth private investors and foreign investors. But now local banks and Shinkin bank are the major investors in J-REITs.
Main player #3 who support the growing interest in Japanese real estate: The local banks and Shinkin bank The local banks and Shinkin bank entered the REIT market before the 2008
Lehman collapse, and unfortunately suffered major losses at that time. But now they have again re-entered the real estate market as tremendous excess liquidity in the Japanese banking system again searches for higher returns.
Also, it appears that they are positive not only on REIT but also for financing related to real estate. It appears that new loans for real estate investment is now declining, so many investors are now considering refinancing their loans to reduce their borrowing costs.
Main player #4 who support the growing interest in Japanese real estate: Wealthy individual Asian investors
Currently, the high-grade condominium sector in the Tokyo metropolitan area is finding strong interest with some individual Asian high net-worth investors. Japanese monetary easing (“Abenomics”)and the depreciating Japanese Yen has made Japanese real estate much more attractive to wealthy Asian investors.
In the past, condominiums in the Tokyo metropolitan area were out of reach of most foreign investors and were labelled “the most expensive in the world.” However, since the Heisei bubble economy burst (around 1991), prices have fallen very significantly, but have remained stable and appeared to have bottomed out over the past several years.
On the other hand, other major Asian cities have experienced boom times since the beginning of 2000. Real estate prices in Hong Kong and Singapore have more than doubled since 2000, and in some locations have exceeded the median price of Tokyo.
Wealthy Asian investors, especially those from China, typically prefer to invest in “real” assets such as gold or real estate. With real estate prices in Shanghai and Hong Kong soaring each year, Tokyo now look increasingly attractive.
Yen depreciation and the continued appreciation in the Chinese Yuan also makes Japanese real estate even more attractive. It appears that assets priced between JPY 50 to 70 million (USD$ 500,000-700,000) are most popular with wealthy Asian investors.
Main player #5 who support the growing interest in Japanese real estate: The corporate pension fund and SWFs
The corporate pension fund and SWF (foreign governments’ Sovereign Wealth Fund) who have at least JPY ¥100M class investment resources are now proliferating. Many foreign countries’ SWFs are now allocating a bigger chunk of their investment portfolio to investments in Japan.
The corporate pension fund can be a major player, especially corporate pension funds from developed nations have expanded rapidly into the Japanese real estate sector since 2012. For example, a Canadian pension scheme, with assets of C$16 billion, has increased its portfolio weighting in Japanese real estate investment from 4.9% in 2007 to 10.9% in 2012. In the US, a California corporate pension fund, with assets in excess of $22 billion, has significantly increased its portfolio emphasis on real estate investment from 3.5% in 2009 to 10.5% in 2012.
Many pension funds, be they corporate or SWFs, are increasingly targeting real estate investments outside of their own country. Japan in general, and Tokyo in particular, is seen as a prime target for consideration on many investors’ radar. Foreign fund managers expect current positive sentiment in the Japanese real estate market to continue into 2014.