Saturday, July 30, 2011

Japanizing of the Global Economy

Heavily indebted economies of Europe won’t collapse. They will enter a prolonged stagnation like Japan did in the 1990s, dragging the rest of Europe along. The US economy won’t collapse either. It will also slide into Japanese-style stagnation, dragging along emerging economies that have been thriving on its large and robust consumer market to sell their products—I call it the Japanization of the global economy.


The parallels between what happened in Japan in the 1980s and the 1990s and what happened in the US in the 2000s and the early 2010s are too similar to ignore: The blow and burst of residential and commercial real estate bubbles followed by massive monetary and fiscal stimulus that kept Japanese and US economies off the cliff, but failed to sir them back to their long-term growth path; leaving governments in both countries in heavy debt loads.

While not ignored, these parallels have been, unfairly, disregarded by mainstream economists and analysts alike, arguing that the US and Japanese economies are different in several respects. One difference is the role and the importance of the Federal Reserve vis-à-vis Bank of Japan. The Federal Reserve has a tradition of independence from the government, and therefore, can act faster rather than later when there is a clear and present danger for the economy. Yet the Bank of Japan began to act about six months after land prices began to slide, while the Federal Reserve was debating whether there was a real estate bubble six months after it burst.


Another difference is that American markets and most notably the banking system are more flexible and more responsive to crises than Japanese markets. This premise, however, doesn’t provide a magical solution to market imbalances that can be eliminated only through price adjustments. What it does provide is a fast rather than a slow and torturous adjustment. A third difference is in level of savings. Japanese households were savings nearly 20 percent of their disposable income when the housing collapse began in 1991. By contrast, the American saving rate is currently in the low single digits causing US consumers to borrow heavily to maintain their level of spending; and Visa’s record second quarter profit results confirm it.

Irrespective of which side one takes on this debate one takes, recent evidence on the US economy, including weak May and June employment reports, and today’s weak GDP report confirm that the US economy is heading for a prolonged stagnation-at a time that both monetary and fiscal policy are max-out. But what it means for investors?

Real Estate: Land in Japan is worth less than half its 1991 peak, while property in the United States has more than tripled in value, to about $17 trillion.
Homeowners were among the biggest victims of the Japanese real estate bubble. In Japan's six largest cities, residential prices dropped 74 percent from 1991. By most estimates, millions of homebuyers took substantial losses on the largest purchase of their lives.
Their experiences contain many warnings. One is to shun the sort of temptations that appear in red-hot real estate markets, particularly the use of risky or exotic loans to borrow beyond one's means. Another is to avoid property that may be hard to unload when the market cools.

Equities. While a slow-growth-low interest rate environment is usually good for stocks, stagnation isn’t. The Japanese stock market, for instance, is significantly below the levels it was at when the Bank of Japan launched its several rounds of QE, while the Japanese government built roads and bridges to everywhere and to nowhere.

Commodities. Whether industrial or consumer, including gold and silver, cannot defy a weak economy. Gold, for instance, declined throughout the 1990s, before take off in the early 2000s, catching up the US real estate bubble.

US Treasuries. A stagnant economy is usually associated with steady or even declining inflation, and that is certainly good for fixed income securities. The problem, however, is that fixed income prices are negatively affected by sovereign risk associated with soaring government debt. As evidenced by the performance of the Japanese government fixed income securities, as well as, by the behavior of the US Treasury market after the release of the first quarter weak GDP numbers, a weak economy supersedes sovereign debt risks for mature economies—a bullish case for bonds.

The bottom line: The US and the world economies cannot avoid Japanization, a bearish trend for Real Estate,stocks and commodities, but are bullish for US Treasuries.

Saturday, July 2, 2011

Gretchen Parlato - "The Lost and Found"

A look at the making of Gretchen Parlato's sumptuous new album, The Lost and Found. Filmed at Symphony Space and Sear Sound this past summer, the film offers insight into the inspiration behind new songs written by Parlato as well as covering jazz standards. The EPK was created by Jeremy Kotin, featuring appearances by Alan Hampton, Robert Glasper, Dayna Stephens, Taylor Eigsti, Derrick Hodge and Kendrick Scott & Clarence Penn.


The album "Lost & Found"is tight!! I love Gretchen's voice and the vibe of the band!
This album is guaranteed to give you goose bumps! All of the musicians were in the zone (including Gretchen of course)! The Lost and Found is my favorite album of the year and will be my favorite for a long time to come.


Saturday, April 16, 2011

Japan's Lost Decades A Myth.

Japan's Lost Decades A Myth


The earthquake, tsunami, and lingering nuclear crisis in Japan have devastated that country's people and their place in the global economy. Can the island nation recover? To see where Japan might go next, we have to look at one of the persistent myths about its recent past — the myth of the lost decades.
It is widely thought that Japan is in the 21st year of a recession, or at least of a muddle-through sluggish economy. Part of this poor performance, economists and the financial press habitually state, is that Japan has experienced a terrible deflation. Nevertheless, I claim that Japan's economic state for the past two decades, up until the recent disasters, has in fact been comparable to that of most developed nations.

What Is Economic Growth?

To understand Japan's actual economic growth, we first have to agree on just exactly what economic growth is: it is the production of goods and services. All of our banks, factories, tools, trucks, natural resources, and labor are used almost solely for the ultimate purpose of producing consumer goods — things that we each want and need in our lives in order to stay alive, remain healthy, clothed, and comforted, to enjoy life and to live as well as possible.
An increased standard of living (material well-being, not spiritual or psychological well-being) consists of having more things. The more things we produce — medicines, heaters, sofas, clothes, hammers, sandwiches, suntan lotion, etc. — the better off our lives.
As I will explain below, an economy's growth is not easily or accurately measured with a calculation based on the dollar amount of money spent on goods. Not only are statistical indices like GNP and GDP inaccurate, they are unneeded as far as observing real economic growth. Ordinary citizens in Denmark do not need to compare GDP per capita to know that they live better than ordinary citizens in Somalia. One can simply look around and see what kind of homes, streets, restaurants, grocery stores, and other goods and services are available in each of these countries, and how many hours of labor are needed to acquire these things.
Similarly, in any particular country, one can look around and see whether there are increasing amounts of goods and services over time — i.e., whether there is a positive rate of change of economic growth. The true test of economic growth is whether or not a given amount of physical labor can acquire more goods and services each year.

A Citizen's View of the Japanese Economy

A journilist recently featured two articles describing Japan and Japanese life by people who live here.[1] Below are some of their statements:
  • "But, I would argue, Japan in 2011 for very, very many who live here is a much better place than the headlines might lead one to believe."
  • "Condos sprout like mushrooms and mortgages can be paid off in decades, not in tens of decades."
  • "As I look out from one of the newsrooms in our 35-floor headquarters, built during one of the Lost Decades, I see what was a nearly abandoned railroad yard 15 years ago is now a virtual forest of 20- to 50-storey buildings where more than 60,000 people a day now work.
    A decade ago, these were just holes in the ground."
  • "Around our condo in Yokohama, shopping malls, offices, condominiums and single-family housing have been popping up nearly every day of the last two decades."
  • "Those years may be the Lost Decades, but they have not been the Do-nothing Decades."
  • "Thirty years ago, when my wife and I lived about two hours outside Tokyo next to a 'small town' of about 600,000, we had to go to one of only a handful of shops in Tokyo to buy a piece of decent cheese.
    Now, cheese is nearly ubiquitous, and half the price it was 30 years ago."
  • "The strong yen, so much the bane of exporters, is the domestic consumer's friend.
    Imported cars, food, clothing, even energy and raw materials for industry all cost less now than 20 years ago.
    A nice bottle of Italian wine that sells for about $15 in Tokyo carried a price tag of $45.95 in Sydney Australia, also a bottle of Johnny Walker Blue cost me over $300 dollars in Gold Coast Australia and only $75 in Tokyo."
  • "Restaurants now offer the finest foods the world has to offer at prices most can afford."
  • "Hotels prices are again reasonable, train fares are affordable and airfares, particularly for overseas travel, are barely [recognizable] from those in the days it took nearly a month's salary to fly to Toronto and back."
  • "Certainly anyone who visits Japan these days is struck by the obvious affluence even among average citizens. The cars on the roads, for instance, are generally much larger and better equipped than in the 1980s"
  • "Overseas vacation travel has more than doubled since the 1980s. The Japanese boast the world's most advanced cell phones, and the biggest and best high-definition television screens. Japan's already long life expectancy has increased by nearly two years. Its Internet connections are some of the world's fastest — something like ten times faster on average than American speeds."
  • "The label on everything from cell phones to laptop computers may say 'Made in China' but actually, via producers' goods, highly capital-intensive and knowhow-intensive manufacturers in Japan have quietly done much of the most technologically demanding work."
  • "The [producers' goods] competition has come principally from Japan, which now enjoys broadly as dominant and geopolitically important a position as the United States did in the 1960s. Even if you don't hear much about this from the Tokyo talking heads, it is hard to miss it in global trade figures."
  • "And this is now a kinder, gentler place."

It's All About the Numbers

So how do we reconcile the discrepancy between the official economic data and the circumstantial empirical data above? The answer I suggest is that the official data are flawed, because they are based on bad economic theory and statistics trying to aggregate factors that can't easily be aggregated. The core of the discrepancy is that (official) economic growth is being measured in money, and money is not wealth.
The misleading measurement of growth in question is GDP growth, because it is practically the sole indicator used by professionals to assess economic output. The problem is that GDP is in fact not a measure of real, physical production of goods and services, as it is intended to be. It is primarily a measure of inflation, which it is not intended to be. To understand this, we must be clear on what inflation is and what causes it.
In short, prices can rise overall throughout an economy only if the quantity of money in the economy increases faster than the quantity of goods and services. (In economically retrogressing countries, prices can rise because the supply of goods diminishes.)
When the supply of goods and services rises faster than the supply of money — as happened around the world during most of the 1800s — the unit price of each good or service falls, because a given supply of money has to buy, or "cover," an increasing supply of goods or services. George Reisman offers us the critical formula for the derivation of economy-wide prices:

In this formula, price (P) is determined by demand (D) divided by supply (S).[2] Aggregate prices consist of the amount of money spent to buy everything in the economy, divided by the quantity of items sold. The formula shows us that it is mathematically impossible for aggregate prices to rise by any means other than (1) increasing demand, or (2) decreasing supply — i.e., either by more money being spent to buy goods, or by fewer goods being sold in the economy.
In our developed economy, prices are rising due to more money entering the marketplace, not because the supply of goods is decreasing — or at least they are not decreasing at enough of a pace to raise prices at the usual rate of 3 or 4 percent per year.
The same price formula noted above can equally be applied to asset prices — stocks, bonds, commodities, houses, oil, fine art, etc., and also to corporate revenues and profits. As Fritz Machlup states,
It is impossible for the profits of all or of the majority of enterprises to rise without an increase in the effective monetary circulation (through the creation of new credit or dishoarding).[3]
In sum, the price of anything in the economy — absent economic retrogression — can rise only with more money and spending. Even though prices of particular goods or commodities can rise from a relative increase in demand, it is impossible for the prices of a majority of goods or assets to rise simultaneously without additional money pushing them higher.
A progressing economy is one in which an increasing quantity of goods is produced over time. It is real "stuff," not money per se, that represents real wealth. Further, if goods are produced at a faster rate than money, prices will fall. With a constant supply of money, wages would remain the same while prices fell, because the supply of goods would increase while the supply of workers would not. But even when prices rise due to money being created faster than goods, prices still fall in real terms, because wages rise faster than prices due to the same expansion of the supply of goods relative to the supply of labor. In either scenario, if productivity and output are increasing, goods get cheaper in real terms.
Obviously, then, a growing economy is reflected in prices falling, not rising. No matter how many goods are produced, if the quantity of money remains constant, the only money that can be spent in an economy is the particular amount of money existing in it (and velocity, or the number of times each dollar is spent, could not change very much if the money supply remained unchanged).
Therefore, GDP, which measures money prices, does not necessarily tell us much about the number of actual goods and services being produced; it only tells us that if GDP is rising the money supply must be rising, because a rise in GDP is mathematically possible only if the money price of individual goods produced is increasing to some degree. Otherwise, with a constant supply of money and spending, the total amount of money companies earn (the total selling prices of all goods produced) and thus GDP itself would all necessarily remain constant year after year.
To be perfectly clear, this means that price deflators applied to GDP calculations to adjust for price inflation do not fully deflate GDP. If they did, real GDP growth would, by mathematical necessity, be zero. (For a more detailed exposition on GDP, see pp. 423–427 in Kelly, The Case for Legalizing Capitalism).
While GDP can increase only with more money and spending, it is obvious that the only source of an increase of money and spending is an increase in the supply of money itself, which in turn can come only from the central bank. Businesses do not create money; they create goods and services. Only the central bank and the member banks have the ability to create money.[4]
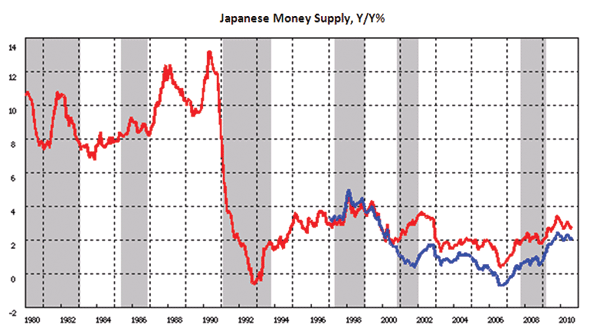
When central banks pump a lot of money into the economy, they boost GDP growth (along with corporate revenues and especially profits). Conversely, when they don't, GDP does not grow very much. Thus, Japan's GDP growth has been slow because Japan's central bank, The Bank of Japan (BOJ), has intentionally engaged in a conservative monetary policy for most of the last 20 years, as seen in 
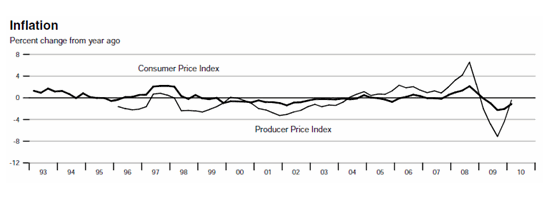
figure 1. The growth of the monetary base averages less than about 5 percent per year. While M1 money supply bounces around, it averages less than 10 percent while the broader M2 money supply averages 2–3 percent. Consumer price inflation, in turn, as shown in figure 2, has remained near flat.
That last sentence is worth repeating: consumer prices have been mostly flat — not falling. The "deflation" Japan is supposed to have experienced over the last 20 years — as commonly stated by financial journalists and professional economists — really consists of prices periodically falling 1, 2, and sometimes 3 or 4 percent over a year or two before returning to slight positive growth rates. All in all, consumer prices have seen a slight increase, not decrease over the last two decades.

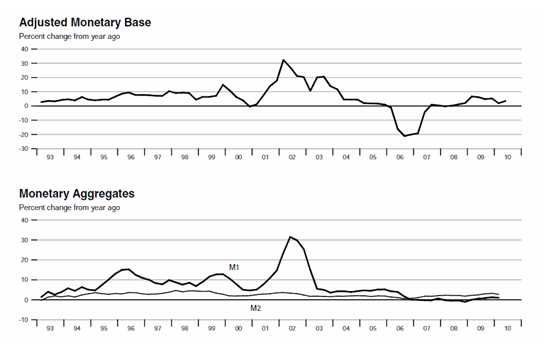
Fig. 1.
Japan's monetary base and money supply, 1993–2010. Source: Federal Reserve Bank of St. Louis.
Fig. 2. Japan's rate of consumer price inflation, 1993–2010. Source: Federal Reserve Bank of St. Louis.
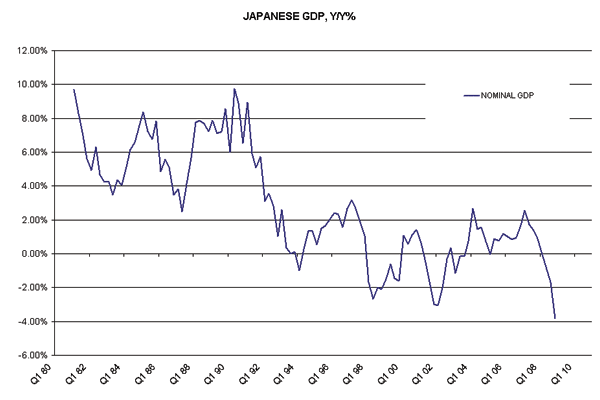
Now observe in figure 3 how much lower money-supply growth has been in the 1990s and 2000s as compared to the 1980s. In figure 4, describing that same time frame, you will notice a reduction of GDP; it went from being in the 4 percent to 10 percent range in the 1980s to the −2 percent to +2 percent range in the 1990s and 2000s.
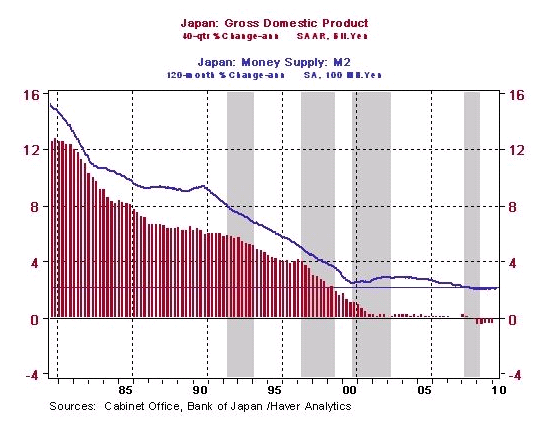
The same evolution is presented from a slightly different angle in figure 5, where, instead of real-time changes as depicted in figures 3 and 4, GDP and money supply are smoothed in the form of a 40-quarter (10-year) compound annual growth in Japanese nominal GDP and the 120-month (10-year) compound annual growth in the Japanese M2 money supply.
It should be noted that, because it takes time for new money to multiply and be disseminated in the fractional-reserve system, money supply has a delayed effect of about one to two years on GDP growth.
Fig. 3. The decline in Japan's money-supply growth rate since the 1980s. The red line is M2, and the blue line is M3. Source: Bank of Japan.
Fig. 4. The decline in Japan's GDP growth rate since the 1980s. Source: Seeking Alpha.
Fig. 5. Japan's GDP and money supply moving together.
The lagged money supply affects both GDP and prices (because GDP consists of prices). As would be expected, Japan's GDP and M2 have moved largely in line with each other (figure 5). Notice that after the money supply dropped precipitously in 1990 (as seen in figure 3), GDP, after peaking, fell off over the next two years (as seen in figure 4).
The sharp decline in the money supply (and corresponding spending levels — velocity changes in the financial markets, in this case) shown in figure 3 is what is responsible, not only for the ensuing decline in prices and GDP, but also for the more immediate decline in asset prices in Japan. 
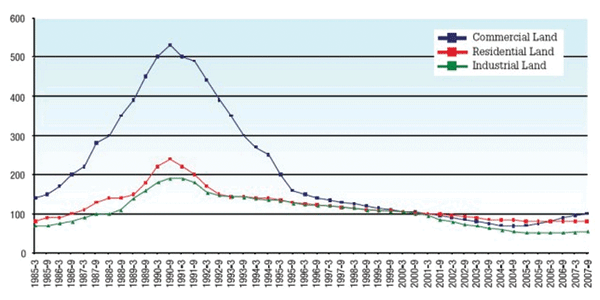
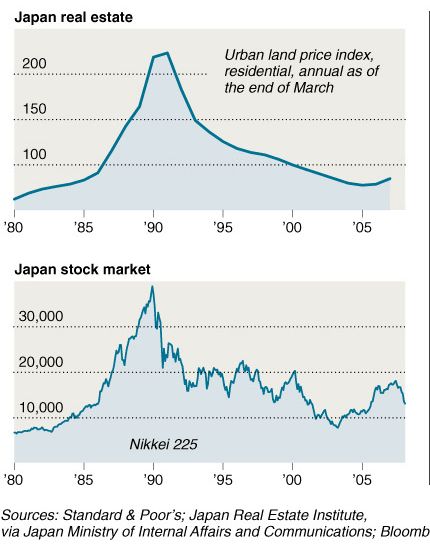
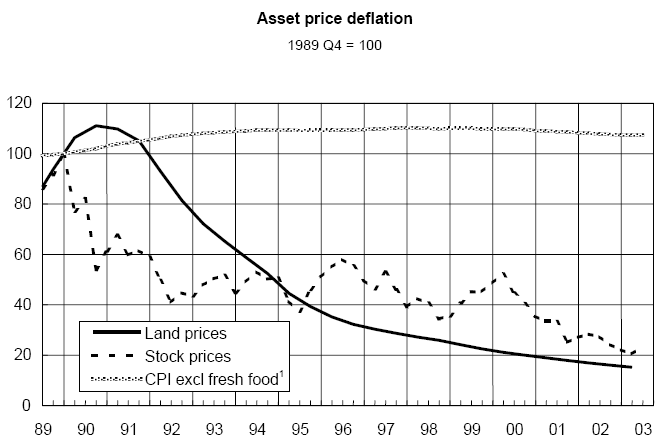
Figure 6 shows the dramatic boom-and-bust sequence of Japan's real-estate prices, and 
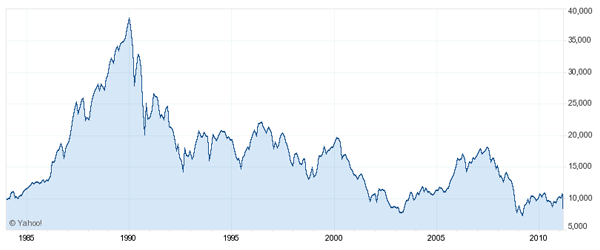
figure 7 shows the same for its stock market. The real estate market fell 85 percent from its high, while the stock market fell 82 percent from its high — just as the Dow Jones fell 89 percent from its high after 1929, due to the US money-supply collapse.
Asset prices rose more dramatically than consumer prices in Japan during the 1980s boom because, of the tremendous amount of money created, disproportionately more was inserted into the financial system than into the real economy. In other words, most of the new money created was used for financial investment and speculation rather than for spending on capital, labor, and consumer goods. Logically, when credit creation slowed in the late 1980s — and the inevitable spending reduction, bank/business losses, and monetary contraction appeared — the evaporation of money and the consequent selling of assets occurred in the financial markets much more than in the real economy. What went up the most came down the most. On the downswing, the asset markets deflated; but the real economy — and GDP — not as much.
Fig. 6. The Japanese real-estate-market boom and bust (six large city areas). Source: Japan Real Estate Institute.
Fig. 7. The Japanese stock-market boom and bust (Nikkei 225 Stock Index). Source: Yahoo Finance.
It is precisely because the money supply has not been pumped back up and directed into the financial markets that the Japanese stock market has remained dead for the last two decades. And unless Japanese consumers decide to forego consumer goods — including their houses — and buy stocks, it will remain dead until more newly created money from the BOJ pushes it higher. But, crucially, the "dead" stock market harms neither Japanese consumers nor the Japanese economy.

Proof of Japan's Growth

So far we have seen evidence that there was a decline in Japan's money supply, and therefore in consumer prices, asset markets, and GDP growth. I have also said that GDP growth per se is merely a statistic that does not represent real economic growth. The primary goal of this paper is to show that while GDP has grown at a snail's pace, real economic growth has been rather robust — approximating real economic growth in other developed countries.
If Japan, as I claim, has indeed seen economic growth similar to other developed nations, we would expect its GDP per capita to have remained in line with theirs. Though GDP growth of a single country does not tell us much, a comparison of GDP per capita between countries does. This is due to the fact that GDP is mainly a measure of money. Largely free-floating currencies, such as those of Japan and the United States, are adjusted by the markets so as to maintain relative prices between the two countries in order to keep purchasing power at parity. This (largely) cancels out inflation-induced changes. In similar fashion, adjusting GDP per capita by a calculated purchasing-power-parity (PPP) figure should also compensate for changing inflation rates between Japan and the United States.
For example, if the United States expands the money supply at twice the rate of Japan, America's consumer prices and GDP should rise at approximately twice the rate of Japan (though relative stated GDP changes in various countries — as well as their price deflators — are quite questionable due to their being subjected to different levels of calculation manipulation by the respective authorities). Because there is then twice the excess amount of dollars relative to yen and double the prices in the United States relative to Japan, the dollar should fall by half against the yen. This adjustment for money and prices keeps respective GDP values adjusted in real terms.
Now let's look at the data. If Japan's economy has truly remained mostly flat, as most of the financial world claims, while America's has mostly risen, then Japan's GDP per capita, as measured in dollars at purchasing-power parity, should be not too far above where it was in 1990 at the beginning of Japan's "lost decades." It should certainly not be at the same level relative to America's or Europe's GDP per capita. In this case of largely flat growth, a chart of GDP per capita would look similar to figure 8, which shows the GDP per capita of Sierra Leone, or figure 9, which shows that of Haiti, which rises slightly.[5] In other words, it should look like the GDP per capita growth trend of countries that truly haven't grown very much.
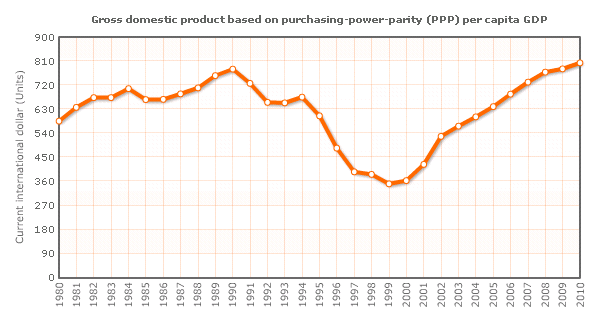
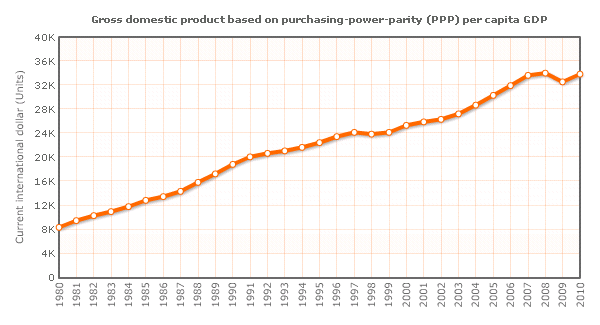
But in fact, Japan's GDP per capita at PPP has increased consistently, as figure 10 shows. In other words, GDP per capita in Japan has grown through time,[6] rising from $19K per capita in 1990 to $34K in 2010. Similarly, the United States had a GDP per capita of $23K in 1990, and it is at $46K today. America's GDP per capita is thus 100 percent higher than in 1990, while Japan's is 79 percent higher. This is close enough to call it somewhat comparable. (Keep in mind that these formal GDP per capita calculations are far from precise and reliable; it is entirely possible that real growth in Japan is, say, 105 percent higher while that of the US is 85 percent higher. The point is that even the official data produced by professional economists show that Japan has grown considerably.)
Fig. 8. The sluggish economy of Sierra Leone. Source: International Monetary Fund, "World Economic Outlook," April 2010.
Fig. 9. The sluggish economy of Haiti. Source: International Monetary Fund, "World Economic Outlook," April 2010.
Fig. 10. Japan's increasing GDP per capita over time. Source: International Monetary Fund, "World Economic Outlook," April 2010.
Figure 11 
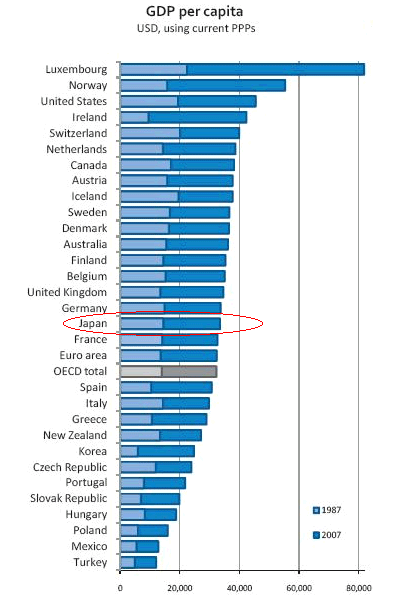
shows another view of the same phenomenon, and the best proof that Japan has grown in line with other developed countries. The chart shows GDP per capita across the OECD countries (a group of developed and mostly-developed countries) in both 1987 and 2007. Japan's GDP per capita in 1987 (the light blue bars) was just about completely in line with Germany's and France's, the countries directly above and below Japan in this ordered ranking. Twenty years later in 2007 (the dark blue bars) Japan still had GDP in line with the same two countries — just slightly below Germany's and just slightly above France's. The proportions are unchanged!
If it were true that Japan has seen dramatically slower growth over the last 20 years than have other developed countries, Japan could not still have the same relative position in GDP per capita 20 years later. Judging by the size of the light blue 1987 bars, Japan had about the same relative proportions then as now (or as in 2007 in this case, just before the world financial crisis arrived). So, if Japan has been in a recession the last two decades, then so have Germany and France and other developed countries. In fact, Japan, after all its supposed lack of growth, still ranks above the OECD average.
Clearly, GDP growth is an uninformative measure. Japan's economy has been healthy even though economists the world over have bemoaned its stagnant growth.
Fig. 11. Japan's GDP per capita remaining in the same proportion as other countries. Source: "OECD in Figures 2008," OECD Observer.

Additional Explanations and Reconciliations

The Rising Currency

One might think that part of the reason that Japan has seen its GDP per capita increase over the last 20 years is that its stronger currency translates its GDP — when using currency values instead of PPP — to a higher number. But the currency movement is not responsible. The currency has risen precisely to adjust for relative prices, because Japan has had less price inflation due to having created less money and credit (in fact, the rise of the yen really reflects the fall of other currencies). The currency changes have kept the GDP measurement accurately adjusted.
The higher currency has helped, not harmed, the Japanese people, by giving them more purchasing power domestically. It has not made much of a difference internationally, because the currency has simply adjusted for prices. A country can print lots of money or not, but free-floating currencies will adjust for real purchasing power.
Had Japan printed no money at all over the last 20 years, it would have seen its currency rise even more. Additionally, domestic prices would have fallen. This would not have been deflation, which is falling prices due to a contraction of the money supply. It would have been falling prices due the fact that goods and services were being created faster than was money. Unlike deflation, falling prices help everyone.
Prices have stayed mostly flat in Japan because the quantity of money has increased at about the same pace as the quantity of goods. And with respect to goods prices specifically, the money supply has effectively increased at a faster rate than official monetary aggregates because money has flowed out of the equity and housing markets and into the consumer-goods markets. More money is not needed to grow an economy, as any amount will do; prices will adjust to the quantity of money — just as they do when money is created faster than goods. In fact, the less money is created, the faster the real economy will grow.

How Did the Economy Expand without Bank Loans and Credit Growth?

Given my exposition of Japan's true growth, many might wonder exactly how Japan's economy has grown without much credit creation and bank lending, because it is well known that Japanese banks have been carrying bad loans on their books for many years, and that they are hesitant to lend for that and various other reasons.
To begin with, banks have actually been lending, just at reduced rates relative to historical standards (and in part because of the fact that money and thus credit are being created at a reduced rate). Also, there are other types of lenders today in Japan in addition to traditional banks.
But, more importantly, it needs to be understood that new credit is not required for a country to prosper. In fact, more credit — as opposed to more real savings — creates economic problems and slows an economy.
Once prices adjust to the newest credit created, the amount of credit available in an economy reflects the amount of real monetary savings. To then create additional credit in excess of real savings increases the amount of claims used to acquire the very same real, physical capital that the real savings is intended to purchase — this is similar to a game of musical chairs where, instead of chairs being taken away, people are added. After prices adjust, all the credit that existed prior to the creation of the new credit has been diluted by the addition of the new credit. Thus, creation of fiat money reduces the real purchasing power of each unit of savings and of previously created credit once price inflation sets in.
Artificially created credit also causes economic boom-and-bust sequences due to the malinvestments and subsequent liquidations that excessive, false savings (i.e., credit masquerading as savings) creates. The new money artificially alters interest rates, profits, relative prices, and other market signals, causing a misallocation of capital that unnaturally expands some industries relative to others. The more credit created, the more is the economic distortion of the production structure, and the greater is the corrective process required once the money flow slows or stops. The more economic distortion that comes about, the more real capital that is ultimately destroyed through malinvestment. (For a relatively concise explanation of this process, see pages 141–155 in my book.)
Japan has not been creating credit at a high rate, so it has not diminished the value of its real savings through inflation or through financial and economic booms and busts at a high rate (compared to Japan previously, and to other countries).
It is critically important to understand that if a country does not continually destroy real savings and real capital through credit creation and inflation, it does not need to continually save and accumulate new funds for investment. The idea of seeking more and more savings for investment purposes each year in most countries is prevalent only because the current stock of monetary savings and capital is continually being diminished by credit creation and inflation (this aside from the physical capital which is destroyed via malinvestment).
When credit is not diminished in this way, it remains intact, and its value increases through time as prices fall. In this way, the same capital can fund more investments through time, and new and additional capital is not constantly needed to replace previous capital.
The fact is that in an economy without inflation and boom-and-bust scenarios — both of which destroy capital — the very same capital base can grow an economy without new savings. All that's needed is that a sufficient proportion of the existing physical capital be allocated to the production of capital goods relative to the production of consumer goods. An economy's capital goods — its tools, factories, machines — and the corresponding labor devoted to capital-goods production produce all new capital goods as well as all new consumer goods.
As long as enough monetary demand — out of the same annual lump of money existing in the economy — is geared toward capital goods versus consumer goods each year, there will be enough production of capital goods to (1) replace the capital goods worn out in production (2) produce a greater net amount of capital goods than were produced the previous year. An increasing amount of capital goods each year will produce an increasing amount of consumer goods each year (and as the supply of goods increases relative to the static supply of money, prices will fall by the year).
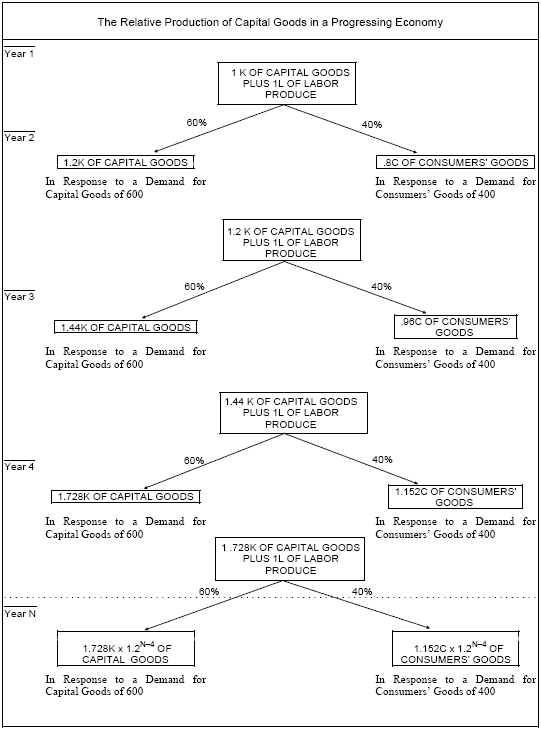
For a visual understanding of this, see George Reisman's example from his book Capitalism (p. 625) in figure 12. Here, the amount of capital goods (set of boxes on the left side) produced each year is in excess of the amount needed to replace used up capital goods (and this simple model assumes all goods are used up each year). This leads to a constantly expanding amount of capital goods (1.2K, 1.44K, 1.728K, etc., where "1K" represents any given physical amount of capital). The process is similar to compound-interest growth.
Fig. 12. A model economy growing without additional capital being added.
Each year, because more capital goods are created, so are more consumer goods (the boxes on right side, which represent the amounts consumed). The key is having a sufficient proportion of monetary spending devoted to production instead of consumption: in this case, 60 percent to capital goods and 40 percent to consumer goods. All production is done without any new and additional savings or credit. The same amount of physical savings (the original 1K of capital in year 1) that the same amount of monetary savings/demand (the 600 units of money/spending) purchases is used each year to produce a constantly increasing amount of capital, goods, and services.[7] Any new and additional (real) savings/demand on top of this — a ratio of, say, 70/30 — would simply increase the rate of growth of production. For perspective, it should be understood that if the ratio was low enough, such that the amount of capital and consumer goods produced would exactly offset the amount used up, the economy would be stationary — it would neither grow nor shrink. And if it were even lower, the economy would retrogress.
Returning to the case of Japan, because the country has destroyed and inflated away very little savings and capital over the last 20 years — that is, because it has largely been using the same capital — the evolution of its production structure is similar to that in our example. True, capital is destroyed each year via consumption spending (i.e., stimulus spending, social welfare spending, etc.,), smaller boom-bust sequences, regulation/restrictions, and other government distortions, but there is enough capital being created each year, in addition to the high level of domestic savings available, to cover that amount of capital loss.
Even before the recent financial and economic crises, all developed economies experienced similar annual destruction of capital through taxes and other interventions. All economies are distorted and consume capital in myriad ways. But on a net basis, the capital destroyed is offset — if only slightly — by new capital created. Japan simply has different distortions — and strengths — from other countries.
Figure 11 also helps us see the fallacy in thinking that new money and credit could create more real demand. Real demand can come only from goods or services actually produced, which can in turn be exchanged for other goods and services. What's needed are more goods, not more claims on goods, i.e., money. More monetary demand will not genuinely put more people to work or spare capacity into use; but eliminating the artificial impediments causing this spare capacity will.[8] New money and credit will simply create a relative overproduction in some industries (e.g., real estate) relative to others.
An increase in money for the purposes of stimulating demand does not cause an increase in the production of real goods but only the appearance of such an increase. This appearance occurs through inflation and through the corresponding overinvestment in some industries — it gives the false appearance of an economic boom. Additional credit and inflation simply causes prices to increase as they adjust to the increased amount of money. The amount of real, physical goods stays the same.
The bottom line is that Japan has not needed new bank credit, or even much new real savings and capital, in order to prosper. It has just needed to maintain a sufficient proportion of capital (i.e., savings) allocation to efficient capital-goods production.

Summary

Despite conventional opinion, Japan's economy has not been stagnant; it has in fact been growing in real terms — although not in monetary terms. The crucial point is that monetary changes do not necessarily reflect real changes. Japan's GDP growth has been slow because money-supply growth has been slow; it is mainly money growth which drives GDP numbers. Therefore, going forward, we must try to observe real economic growth — the production of real goods and services — instead of just GDP. Seeing things in the correct light allows us to recoup Japan's lost decades, which weren't really lost.

Wednesday, March 23, 2011

Japan Earthquake "Economic Stimulas" ?

Earthquake May Boost Economy Short Term: Summers says, (Is this Economic Stimulus?)
http://www.cnbc.com/id/42002647
View the link above to read Summers comments.

Larry Summers the former director of the White House National Economic Council for President Obama and a strong believer in Keynesian so-called “stimulus”, commenting on the economic impact of the tragic tsunami which has struck Japan last week.


…It may lead to some temporary increments, ironically, to GDP, as a process of rebuilding takes place. In the wake of the earlier Kobe earthquake, Japan actually gained some economic strength…

This is a shocking statement, or at least it should be. Though he takes pains to wrap this preposterous claim with concern about the loss of life, there is simply no getting around the fact that Mr. Summers is equating destruction with “economic strength”. He is, however, simply following directly in the footsteps of John Maynard Keynes himself who, in his 1936 treatise The General Theory, wrote:

Pyramid-building, earthquakes, even wars may serve to increase wealth, if the education of our statesmen on the principles of the classical economics stands in the way of anything better.

Keynes repeated the “destruction as stimulus” fallacy often. In a 1940 issue of The New Republic, he wrote:

It is, it seems, politically impossible for a capitalistic democracy to organize expenditure on the scale necessary to make the grand experiments which would prove my case — except in war conditions

Keynes was renowned for his sharp tongue and quick wit to be sure. But destruction-as-stimulus is not a mere shock-value rhetorical device for expounding the Keynesian doctrine of aggregate spending. No, it is at the absolute CENTER of the ideology. Paul Krugman, ultra-partisan pundit, was and remains so committed to destruction-as-stimulus that he was willing to actually break partisan ranks and agree with former President Bush (another Keynesian):

Hate to say this, but [Bush] is right when he says:

“I think actually the spending in the war might help with jobs…because we’re buying equipment, and people are working. I think this economy is down because we built too many houses and the economy’s adjusting.”

In fact, I’d say that the sources of the economy’s expansion from 2003 to 2007 were, in order, the housing bubble, the war, and — very much in third place — tax cuts.

Krugman also infamously declared the following on September 14th, 2001, regarding the destruction of the 9/11 terror attack:

These aftershocks need not be major. Ghastly as it may seem to say this, the terror attack — like the original day of infamy, which brought an end to the Great Depression — could even do some economic good.

If that doesn’t turn your stomach, it should. It IS as horrible and misguided as it seems. Still, none of this is new for Keynesians. World War II is, almost without fail and as Krugman alludes to above, THE example of Keynesian-style government spending “working”. I can, in fact, recall no other example which is brought out in support of Keynesian economics by its supporters other than WWII.

It’s wrong, of course. Wars only destroy and only stimulate war-related industries at the expense of everything else in the process. And it should be noted that as WWII was ending there was consensus by Keynesians that the economy would fall back into a depression due the enormous drop in spending. In 1943, Super-Keynesian Paul Samuelson wrote:

…were the war to end suddenly within the next 6 months, were we again planning to wind up our war effort in the greatest haste, to demobilize our armed forces, to liquidate price controls, to shift from astronomical deficits to even the large deficits of the thirties–then there would be ushered in the greatest period of unemployment and industrial dislocation which any economy has ever faced.

He couldn’t have been more wrong. Instead, the economy grew and unemployment remained low even with millions of soldiers returning home and getting back to peaceful work. Keynesian economics should have been relegated to the dustbin of crackpot and crank economics fifty years ago. Instead, it lived on to help cause the 1970s stag-flation (another event deemed impossible by Keynesian doctrine) and other boom and bust cycles around the world… including Japan.

Going back to Japan and its economy, one of the many irony’s in this entire tsunami episode in keynesian follies is that the Japanese government remains perhaps the single biggest peace-time experimenter in Keynesian economics, with nothing but nation-crushing, debilitating debt left as the result. In the 1990s, after an easy-money fueled stock and real estate boom and bust, one virtually identical to our own this past decade, Japan embarked on massive Keynesian “stimulus”, paving the country in concrete including many unnecessary “infrastructure” projects like trains to nowhere. What followed was a malaise known as “the lost decades” or, as I like to call it, the Keynesian hangover.

The lesson here is as simple as it is old. Waste is waste. Destruction is destruction. Costs are costs, not benefits.

We live in a world of scarcity and choice. The resources which must go into rebuilding after war or natural disaster are resources which could and would have gone into other things. The costs associated with this process are not offset through some magical “mutiplier” into net benefits. Prior to 9/11, the US had two sky scrapers and a pile of raw materials. After 9/11, they lost the buildings. At some point they may have new buildings completed there, but the net loss to their society should be obvious. Destruction is destruction.


Tuesday, February 1, 2011

Marc Faber: I like Asian Real Estate in Developed Asian Countries.

Marc Faber : "Basically I am not very keen to buy emerging economies at the present time and I would rather lighten up positions. As far as the equity allocation between equities, bonds, cash and precious metals, commodities and real estate is concerned, that depends on every individual. It is like if you go to the doctor and you tell him ‘oh, what kind of pills shall I take?’ That depends very much on the individual, on the status of his health, on his ailments and so you cannot generalize."

"But for me, I like Asian real estate in Developed Asian countries.
He says that there are questions marks published about the data from China,Inflation in China is much higher than what the Chinese government is publishing,Real growth inflation adjusted growth is lower than what they publish,Banks lending rates and the deposit rates we have a very negative real interest rate that is interest rates adjusted for inflation.
That will lead inevitably to some kind of a Bubble and every bubble bursts, I would be very careful about any further commitments to China."

"The correction in asset markets has begun and at 20% correction from the peak I would buy Real Estate that have strong yields and I would buy some precious metals."


Let me point out and refer to one of my previous posts in January 2011, Japan core Tokyo commercial real estate is now at 20% correction form its peak of 2007.

Anyone in the Real estate business can tell you that yields for Japanese Commercial real estate have risen significantly in the past two and a half years. You used to be able to buy a prime office building in Tokyo with a 3.5% cap rate 2 and a half years ago. REITs now purchase at around 7%, and some recent transactions have even gone above 8%. As I’ve covered previously in various posts, the big investors have become very conservative with their strategies - buying up core Tokyo inner 5 wards properties overlooking most assets out side of the 23 wards. Some of the capital flowing back into Tokyo is from international investors – from all the world’s richer countries, including the US, Australia, Germany, the Middle East, and Singapore.

A glut of capital is now accumulating here in Tokyo looking for investments, chasing not just Tokyo office buildings, but anything with a solid return Core Tokyo. The world’s pension funds, insurance companies and mutual funds are gearing up again. This capital, when compounded through leverage, pushes up the price in investment markets, in turn reducing overall return as we move into another property cycle here in Tokyo Japan 2011.

China's Housing Market Nears U.S., Japan Bubble Levels: Chart of the Day 31-jan-2011

http://www.bloomberg.com/news/2011-01-31/china-s-housing-market-nears-u-s-japan-bubble-levels-chart-of-the-day.html

http://www.bloomberg.com/video/66251718/

Sunday, January 30, 2011

Japan's Property Bubble how we can learn.

It is very difficult to comprehend we have learned very little from past asset bubbles.  Many of all global governments policymakers have turned a blind eye to the Great Depression, euphorically thinking that somehow all variables of risk had been eliminated from the system.  It would be one thing to acknowledge our current predicament and at least try something different from the past to combat the current financial demons most countries are facing.  Instead, Countries like the USA are using policy moves from the past that had little impact in resolving financial problems.

This is primarily occurring with massive focus on lending institutions and banks.  The Federal Reserve with the leadership of Alan Greenspan and Ben Bernanke have focused tremendous energy on this sector while ignoring virtually all historical examples where this failed.  Primarily, with the asset bubble of Japan that occurred from 1987 to 1990 and created nearly two lost decades of economic productivity.  In today’s article we are going to exam a research paper published by the Bank for International Settlements that was presented in October of 2003 at the International Monetary Fund.
It is important to first look at what stage we are in regarding our current asset bubble:
Case Shiller Index
For over a decade not only did asset prices increase, they went into an unsupportable range.  The challenge now and the question most have on their mind is at what level will prices reach a supportable bottom?  After all, year over declines for the Case-Shiller Index didn’t start until 2007.  If we look at the Japanese asset bubble, prices went down for well over a decade.  The USA is ready as a nation to see stagnant real estate prices until 2019?

The chart below, via Bloomberg, shows that China's residential real estate market now accounts for 6.1 percent of GDP. Why is that significant? It's precisely the level residential real estate as a percent of GDP reached in the U.S. before the property market here crashed.

Of course, as shown on the chart in red, the property market in Japan in the bubblicious 1970s reached a height of more than 8 percent of GDP. According to a Bloomberg interview with Shen Minggao, Citigroup's China research head, a 10 percent decline in Chinese property investment would translate to a full percentage point decline in nominal GDP.


Let us first take a look at this current real estate bubble versus that of Japan:

Japan asset bubble us asset bubble


*Source:  Economist
This current real estate bubbles in China and Australia are already larger in scope than that of Japan.  I’ve seen a few people argue more narrowly that Tokyo prices went much higher than anything we have seen in the United States:
comparing asset bubbles
*Source:  Debt Deflation
That is true.  Yet if we look at individual markets like that of Los Angeles for the Case-Shiller Index we get an index number of 273 at the peak.  Keep in mind the Case-Shiller Index for L.A. looks at Los Angeles and Orange County.  If we would segment niche markets here, we will find areas that saw an index above 300, that is certain.  Yet looking at the first Economist chart, we realize that nationwide we have a much bigger bubble here.  If that is the case, why should we expect a short recovery?
Given that we are now in a zero interest rate policy universe, Japan is looking more and more like an apt comparison.  We have a country that had both a stock market and real estate bubble both bursting at the same time.  We had financial deregulation, low interest rates, and a tremendous amount of euphoria fueling an epic real estate bubble.  Sounds familiar?  Well what about billions of capital injections into banks causing zombie institutions dragging growth down for almost 2 decades?
Let us examine crucial parts of the paper:
“What should be noted regarding Japan’s experience is that the enthusiasm of market participants, together with the inconsistent projection of fundamentals, contributed to a large degree to maintaining temporarily high asset prices at that time. Such enthusiasm is often called euphoria, excessively optimistic but unfounded expectations for the long-term economic performance, lasting for several years before dissipating.”
“It was thus excessive optimism rather than consistent projection of fundamentals that mainly supported temporarily high asset prices.”
So on this point, we are similar.  That is, market fundamentals had nothing to do with price rises and the justification given for the boom was usually excessive optimism transmitted by “real estate never goes down” or some other form of delusional thinking.  This kind of thinking on a very short-term basis rarely is a threat to the economy as a whole but letting this kind of thinking continue for a decade is extremely problematic.
“First, at the time of the Iwato boom, when Japan’s economy entered the so-called “high economic growth period”, asset prices increased rapidly, reflecting an improvement in fundamentals due to technological innovations. The real economic growth rate exceeded 10% per annum, driven mainly by investment demand due to technological innovations that replaced the post World War II reconstruction demand. On the price front, consumer prices rose while wholesale prices remained generally stable, thus leading to the so-called “productivity difference inflation”.
“Kakuei Tanaka, who became Prime Minister in 1972, effected extremely aggressive public investment based on his belief (remodelling the Japanese archipelago) that it was necessary to resolve overpopulation and depopulation problems by constructing a nationwide shinkansen railway network, which led to an overheated economy.”
Interestingly enough, we also get an idea that two booms can happen relatively quickly.  The Iwato boom occurred first later paving the way for the Heisei boom or the boom that occurred from 1987 to 1990.  The language from the Iwato boom is very much similar to our technology driven boom of the 1990s where much of the euphoria was driven by new technological innovations.  What this tells us is psychologically, Japan and the U.S. had similarities viewing these booms and also that consumer behavior is largely universal in many respects.  One fueled by technological prowess and the other based on excessive optimism.
“Third, in the Heisei boom, asset prices increased dramatically under long-lasting economic growth and stable inflation. Okina et al (2001) define the “bubble period” as the period from 1987 to 1990, from the viewpoint of the coexistence of three factors indicative of a bubble economy, that is, a marked increase in asset prices, an expansion in monetary aggregates and credit, and an overheating economy. The phenomena particular to this period were stable CPI inflation in parallel with the expansion of asset prices and a long adjustment period after the peaking of asset prices.”
“The decline in asset prices was initially regarded as the bursting of the asset price bubble, and an amplifying factor of the business cycle. Although the importance of cyclical aspects cannot be denied, further declines in asset prices after the mid-1990s seem to reflect the downward shift in the trend growth rate beyond the boom-bust cycle of the asset price bubble.”
This boom and bust is clearly depicted by the bursting of the Nikkei and Japanese land prices:
Japan 1990s
Here we have another similarity.  That of “stable” inflation paving the way for a continuation of relaxed monetary policy.  As I have highlighted before the CPI is a sham and does very little reflecting the actual reality during the boom.  Also, unemployment is poorly reflected.  Why is that?  Unemployment numbers leave a large section of our employment base out, those not looking for work and those underemployed.  The CPI uses the OER measure or owner’s equivalent of rent to measure housing.  This of course practically left out the entire real estate bubble from the CPI measures!  So housing was understated from the CPI for nearly a decade and being a large portion of the CPI, it skewed the measure lower.  Take a look at the CPI for this time period:
CPI federal reserve
Well of course, inflation looks stable when you don’t accurately measure the true growth in asset prices.  Just look at the Case-Shiller Index and you’ll realize there is a major disconnect.  The government also for a long time was looking at the OFHEO housing numbers which of course, only looked at Fannie Mae and Freddie Mac or other conforming government loans which entirely misses the boom with toxic pay option arms, subprime mortgages, and other interest only products.  So what you are left with is poor measures of inflation and housing prices and government policy basing decisions on this terrible information.  Yet the reasons given in the paper presented at the IMF for the Japanese asset bubble seem very familiar:
“The intensified bullish expectations were certainly grounded in several interconnected factors. The factors below are often pointed out as being behind the emergence and expansion of the bubble: • aggressive behaviour of financial institutions
• progress of financial deregulation
• inadequate risk management on the part of financial institutions
• introduction of the Capital Accord
• protracted monetary easing
• taxation and regulations biased towards accelerating the rise in land prices
• overconfidence and euphoria
• overconcentration of economic functions in Tokyo, and Tokyo becoming an international financial centre
Focusing on monetary factors, it is important to note the widespread market expectations that the then low interest rates would continue for an extended period, in spite of clear signs of economic expansion. The movement of implied forward rates from 1987 to 1989 (Figure 5) shows that the yield curve flattened while the official discount rate was maintained at a low level.”
Well look at that.  Aggressive behavior of financial institutions.  Check.  Progress of financial deregulation.  Check.  Inadequate risk management.  Check.  Protracted monetary easing.  Check.  Overconfidence and euphoria.  Big freaking check.  That is why Alan Greenspan and The Ben Bernanke easing monetary purse strings during the euphoria stage was insanely irresponsible.  The signs were already there.  Yet simply looking at inflation via the CPI or housing prices via the OFHEO numbers painted a largely phony picture that we now know is true.  That is, housing prices were increasing while incomes were stagnant and shadow asset inflation was exploding.  How did this happen?  Of course through more and more toxic mortgage products being fueled by an easy credit environment, much of it hidden through the securitization of the credit markets.  If you want to see how the system in Japan was setup, look at this chart:
Japanese financial system
One major difference is Japan is largely a creditor nation while we are the largest debtor nation.  How this changes the equation is largely unseen yet.  You would think, that eventually the U.S. dollar with the Fed and U.S. Treasury determined to sink the value of our currency, would eventually show up in the system as a weaker dollar unfortunately.  Yet last year, one of the few bright spots was the U.S. dollar.  Why?  First, the entire world went into a period of financial deleveraging.  Central banks around the world almost uniformly started dropping rates.  So if we drop rates by .25 points and so does every other nation, we largely offset one another.  That is one major reason why we saw little change.  It is also the case that the U.S. still is a safe haven for global capital.  How long this will remain is largely unknown.
The US has reached the bottom in terms of monetary easing, at least the old school way of doing it.  The USA is largely in a zero interest rate world.  That weapon is now empty.  Other central banks (not Japan) have more wiggle room so it will be interesting to see what occurs when they cut rates while we remain sidelined largely because we cannot do much more in the monetary realm.  Of course we are practically assured a large fiscal program next year so it is hard to see what will happen.  If Japan is any example, not much:
Japanese land prices
“The first lesson is that risks of financial and macroeconomic instability build up during asset price booms and materialise as an aftermath of asset price declines and recessions. In the light of Japan’s experience, it seems to be a characteristic that the effects of a bubble are asymmetrically larger in the bursting period than in the expansion period.
A rise and fall in asset prices, which contain an element of a bubble, influence real economic activity mainly through two routes: (i) consumption through the wealth effect, and (ii) investment through a change in the external finance premium due to changes in collateral and net asset values. As long as asset prices are rising, they influence the economy in a favourable way and the adverse effects are not thoroughly recognised.
However, once the economy enters a downturn, the above favourable cycle reverses, thereby leading to a severe reaction. The harmful effects of a bubble will emerge, exerting stress on the real side of the economy and the financial system due to an unexpected correction of asset prices. If intensified bullish expectations which previously supported the bubble are left unchecked, the expansion and subsequent bursting of the bubble will become more intense, affecting the real economy directly or, by damaging the financial system, indirectly.”
This is a key point.  The bust of the bubble largely erased all gains during the boom and some.  If we are to look at the growth over the past decade, we still have a long way to go even to reach a breakeven point.  Yet the paper makes a fascinating observation that major asset bubbles causes more harm than good once we look at the net add/loss.  We are already seeing consumption being hammered by the loss in wealth.  And just like Japan, our financial system is largely damaged.  Will we have a lost decade as well?  How can that option not be on the table?  We are injecting capital into largely unproductive banks who are now hoarding money to what end?  To buy up other banks?  To lend at low rates?  Who will be their clientele?  Borrowers with too much debt and stagnant wages?  Profitability of banks will be sinking just like Japan:
Profitability of japanese banks
“Looking at the land price problem from the viewpoint of the stability of the financial system, it was the risk brought about by the sharp rise in land prices and the concentration of credit in the real estate and related industries that were insufficiently perceived. During the bubble period, real estate was generally accepted as collateral. However, if the profitability of businesses financed by secured loans is closely related to collateral value, such loans become practically unsecured since profits and collateral value move in the same direction.”
Another important point.  Much of the problems we are seeing are from banks and financial institutions having to realize the actual asset value of their portfolios in the US.  This is problematic when assets were largely brought onto the books in euphoric stages of the boom which now have to be realized at bust prices.  Essentially this assures financial institutions are holding onto underwater loans.
“In a financial system, banks play a buffer role against short-term shocks by accumulating internal reserves when the economy is sound and absorbing losses stemming from firms’ poor business performance or bankruptcy during recession. Even though some risks cannot be diversified only at a particular point in time, such risks can nevertheless be diversified over time. In order to achieve a more efficient allocation of risks in the economy, it is deemed important to have not only markets for cross-sectional risk-sharing but also sufficiently accumulated reserves as a buffer for intertemporal risk-smoothing.
Such a risk-smoothing function of the banking sector, however, is difficult to maintain under financial liberalisation and more intense competition from financial markets. Intertemporal smoothing requires that investors accept lower returns than the market offers in some periods in order to obtain higher returns in others. Investors, however, would opt out of the banking system and invest in the financial markets, thereby deteriorating banks’ internal reserves. As a result, a risk-smoothing function is lost easily and suddenly once the economy encounters a shock that erodes banks’ net capital to the extent that it threatens their soundness.”
“The third lesson is that the effectiveness of the central bank’s monetary easing is substantially counteracted when the financial system carries problems stemming from the bursting of a bubble.”
This is a point where our financial institutions largely ignored risk.  It is interesting that excess reserves for banks are only increasing because they are sucking up bailout money!  That is, they are preparing for a problem that occurred a decade ago with money coming out today!  That is much too late.  That is why it is stunning we are going down the path of Japan.  I’m not sure how we don’t face a lost decade (at least) since we are following the exact playbook.  Injecting capital into banks.  Large infrastructure projects.  And what did it do for Japan?  The Nikkei peaked on December 29, 1989 closing at 38,915.87.  Currently the Nikkei is at 8,859, nearly 20 years later.  That is a drop of 77 percent.  Even with the Great Depression drop prices after 20 years were already approaching the peak set in 1929.  8,859 is a long way from 38,915 and I doubt in 5 years it will get even close to that.  So what is worse here?
“First, an increase in non-performing loans erodes the net capital of financial institutions, resulting in a decline in risk-taking ability (credit crunch).”
“More precisely, during financial crises, financially stressed banks tend to have serious difficulties not only with lending, but also arbitraging and dealing. This hampers the transmission mechanism from the policy-targeted rate to longer-term rates, resulting in segmentation among various financial markets. Thus, it could be extremely important for a central bank to intervene in various financial markets to fix segmented markets, thereby restoring market liquidity and the proper transmission mechanism.”
Japan also had a credit crunch.  So another check there.  Yet the crunch occurs for legitimate reasons.  There is a quick crash bringing together a bubble reality with that of actual reality.  The only obvious outcome is a crunch.  After all, the euphoria dies quickly and panic slowly starts to set in.  That is what occurred in August of 2007.  The same thing occurred in Japan.  Once financial institutions realize their metrics are off, they quickly have to devise new methods of assessing risk.
“Policymakers in the above situation are faced with two different kinds of risk. When productivity rises, driven by changes in economic structure, strong monetary tightening based on the assumption that the economic structure has not changed would constrain economic growth potential. On the other hand, a continuation of monetary easing would allow asset price bubbles to expand if the perception of structural changes in the economy was mistaken.”
“This issue can be regarded as similar to a problem of statistical errors in the test procedure of statistical inference. A type I error (the erroneous rejection of a hypothesis when it is true) corresponds to a case where (though a “new economy” theory may be correct) rejecting the theory means the central bank erroneously tightens monetary conditions and suppresses economic growth potential. A type II error (failure to reject a hypothesis when it is false) corresponds to a case in which a bubble is mistaken as a transitional process to a “new economy”, and the central bank allows inflation to ignite.
Given that one cannot accurately tell in advance which of the two statistical errors policymakers are more likely to make, it is deemed important to consider not only the probability of making an error but also the relative cost of each error. In this regard, Japan’s experience suggests that making a type II error is fatal compared with a type I error when faced with a bubble-like phenomenon. For monetary policymaking at that time, it seemed pragmatic to flexibly adjust the degree of tightening while paying due attention to not only a type II error but also a type I error.”
Sadly, the US made the type II error here.  That is, mistaking a bubble for a new economy.  These mistakes prove even more destructive.  Assuming we followed the type I error the worst thing would have been slowing economic growth when a new economy was here.  Yet there was no new economy so this error is largely irrelevant for comparison.  Both Japan and the U.S. largely mistook a bubble for a new economy.  That is another reason current monetary policy is largely impotent in fixing the current issues.
“It seems most practically feasible for a central bank to deal with asset price bubbles from the viewpoint of contributing to the sound development of the economy through the pursuit of price stability. However, it might be the case that achieving low measured inflation in the short term does not necessarily ensure sustainable stability of the economy.”
“Within the framework of the Taylor rule, Bernanke and Gertler (1999) argue that it is possible for a central bank to deal with potential inflationary pressure in a pre-emptive manner. This is because effects of asset price fluctuations are included in changes in the current output gap. They present simulation results that the BOJ should have been able to achieve better performance if it had pursued a Taylor-type rule that discards asset price fluctuations (Figure 11). In fact, their policy rule points to the need for rapid tightening by raising the interest rate from 4% to 8% in 1988, despite focusing only on the inflation and output gap.”
Ironically, The Ben Bernanke is cited in this paper discussing tighter monetary policy!  The big mistake is the metrics used to measure inflation and housing prices were wrong and if we used say a modified CPI with the Case-Shiller Index for housing prices, inflation would have been much higher thus forcing the central bank to raise rates to stem the asset inflation.  Because in reality, this past decade saw strong inflation if we used better measures of housing and also corrected for stagnant wages.  So what we did is essentially what Japan did.  Eased monetary policy while rampant asset inflation occurred even though the metrics stated otherwise.
We have many lessons to learn here.  There are certainly vast differences between the U.S. and Japan including savings rates, creditor/debtor nations, and diversity of industries.  Yet to quickly dismiss the lessons from Japan as unique is a large mistake, especially the monetary policy mistakes.  If the past is any indicator of the future, we can expect a decade long recession rivaling the lost decade of Japan.  That is, we are going to lock up our precious available capital with those most responsible for the bubble, financial institutions.  You tell me how that $700 billion of the TARP is working out?


A Closer Look at Japan's Deflationary Struggles

In closing, here's a close-up look at Japan's annualized monthly headline CPI since 1990. I've included an overlay of the Discount Rate to help us see one aspect of Government's efforts to manage the economy.


The latest Japanese Consumer Price Index, data through December 2010, shows an annualized monthly inflation rate of zero following two months of mild inflation, which was preceded by 20 consecutive months of deflation. If we make a linear extrapolation of the CPI monthly trend,


See the chart above, we get a return to deflation. Japan's CPI will be especially interesting to watch in the coming months. With inflation on the rise around the world, a return to deflation in Japan would certainly run counter to the growing expectations of inflation hawks.

Both Japan and the US will have hyperinflation, probably within the next 10 years. So will Europe. The global debts are unpayable, which means global banks will be destroyed if deflation is permitted. Central banks have made their predilection known, and they won't stop printing. If we get disinflation, they'll just print more. Japan's 15 years of disinflation is irrelevant in a world where the supply of fiat money has no bound.

All of those countries are certainly at risk of extreme deflation. They can choose sound money at any time and allow their economies to delever. But there is no such thing as inevitable deflation. A monkey with a printing press can prevent deflation, if he has no regard for the human suffering that results from hyperinflation. Ben Bernanke is such a monkey.

Political bias doesn't matter when debt outstrips our ability to pay. Bankruptcy is non-partisan, and that's what we are. One's desire for more or less government is irrelevant; government services will decline because there's no ability to pay. We can only choose deflation or hyperinflation and that choice has apparently been made.


Read more: http://www.businessinsider.com/japan-the-us-bubbles-and-deflation-2011-2#ixzz1DM9O8Hfh

Read more: http://www.businessinsider.com/japan-the-us-bubbles-and-deflation-2011-2#ixzz1DM9AWsSq


Friday, January 21, 2011

Japan Commercial Real Estate Declines by 20% in value over last 2 years

Japan Commercial Real Estate Declines by 20% in value over last 2 years

Japanese commercial real estate markets has fallen by 20% over the two and a half years to the end of the third quarter 2010, the IPD Japan Monthly Indicator shows.


Japan, the world’s second-largest commercial property market by value, is one of the few major real estate markets to continue to record capital depreciation, reflecting the country’s weak economic growth.

By the end of the third quarter of last year, up to which point IPD has its most current Japanese data, UK, the US and Australia had all emerged into positive capital growth. In the UK, the rebound was a significant 17.4%, while the US had risen by 5.5% over the previous six months and Australia had recovered by a modest 1.1%.

Back in Japan, the annual rate of capital depreciation was -6.3% at the end of September 2010 – the shallowest rate of capital decline since December 2008 and a significant improvement on the -12.2% annual capital growth rate in September 2009.

The retail sector, driven by improved consumer confidence, has continued to buck the trend of the broader market by showing an upturn in the capital growth recovery, ending September with an annual capital return of -2.8%. This is the shallowest rate of capital depreciation since July 2008.

At the other extreme is offices, which is running at an annual capital depreciation of -8.3%, reflecting the continuing economic malaise. Between the two sectors is residential, which had an annual capital growth rate of -4.5% to end September 2010.

Sunday, January 16, 2011

Travis Smiley Presents: "America The Next Chapter"

Travis Smiley Presents: "America The Next Chapter". This shows how different opinions and views can debate on the facts peacefully. Without rhetoric or fictional thinking.


The great difference comes from the notion of where greatness comes from.

For someone like Dr West greatness comes from the good people having good education and sweating a lot to do great things.

Maria Bartiromo comes from a world where trading papers creates profit with no work and no sweat at all, a world where the money is created from nothing and then has to come from some place that ends up being the bailouts, paid for by the workers, from their sweat.

Wednesday, January 12, 2011

Does Japans Really Matter?

During the holidays, I pondered on Japans economy and found the least bad route was by asking myself a series of questions.


Does Japan really matter?
Yes, for two reasons. Its experience with a massive asset bubble collapse, a paralyzed banking sector and years of deflation suggest how events might play themselves out in the U.S., which seems to be suffering an echo of Japan’s misfortunes. But even if Japan isn’t a template for the U.S., how Japan’s economy plays itself out could be of significance for the global financial system. Japan, after all, remains the second largest developed-world economy, remains the richest large economy on a per capita basis and has a huge financial sector.
Can the U.S. escape Japan’s plight?
Fed chairman Ben Bernanke certainly thinks so, and is doing his utmost to ensure the U.S. does. That’s what was behind both rounds of quantitative easing: making sure Japan-style deflation isn’t repeated.
Could Japan finally be on the cusp of a “normal” recovery?
The premise behind two decades of routine and extreme monetary and fiscal stimulus has been that Japan suffers from a shortfall in aggregate demand caused by the 1990 stock market and real estate bust. The central Keynesian thesis has always been that once Japan’s banking sector could be cleared up and its excess capacity shrunk, the economy would move back to self-sustaining growth. But Japan has had 15 years of near-zero interest rates and deficit spending that’s taken the government’s net debt from 12% of GDP in 1992 to a forecast 130% this year. Growth looked reasonable during the early parts of the new millennium. But at between 1.9% and 2.7%, it was paltry relative to the pace that prevailed during the 1980s, when Japan was on top of the world and GDP was expanding at an average annual rate of nearly 4.5%. What’s more, even the growth of the last decade continued to be heavily dependent on official stimulus. Could it be that demographics rather than a shortfall in aggregate demand is behind the decline in Japan’s trend growth? But if that’s the case, why isn’t inflation picking up?
Is Japan reaching the limits of Keynesian stimulus?
Even at a mere 1.2% yield on 10-year Japanese government bonds, Japan’s enormous official debt load means that interest payments alone soak up more than a quarter of government revenue. The IMF expects Japan to run annual deficits worth 7.5% of GDP for much of the coming decade. At some point investors will start to worry about getting paid. Not that Japan is likely to default, the debt is in its own currency, which the Bank of Japan can print at will. But they might start to get the nagging feeling that the government has no control of its deficits and no ability to cut them back and that the money printing will become straight debt monetization.
What is Japan’s endgame?
A massive debt load, an inability to cut deficits, debt monetization; all Japan’s roads lead to inflation. Not a little inflation, but hyperinflation. So says Dylan Gryce, a strategist at Societe Generale, and it’s hard to fault his case. This great Japanese unwind could start to happen sooner rather than later. Ironically, it could be triggered by expectations of global recovery, if this were to cause yields to be squeezed up worldwide. It wouldn’t take much of a yield increase for the Japanese economy to be sucked into a vicious cycle of higher deficits, caused by higher interest costs, forcing ever higher yields. Domestic investors have been content to fund the government’s shortfalls. But the domestic savings rate has been dropping as the country ages. Pretty soon it will go negative and the government will have to look to foreigners for finance. And foreigners won’t be content with 1% yields with the prospects of massive devaluation.
Where does that leave the rest of the world?
A number of things could happen if Japan were to succumb to hyperinflation. Investors would undoubtedly flee Japanese fixed-income investments. Would this benefit “high quality” sovereign debt elsewhere? Or would investors decide that all sovereign debt is due a higher risk premium. In which case, alternatives would be preferred? Most probably the sort of stuff that governments can’t make more of. Like commodities. What’s certain is that there would be some serious ructions in global markets.By Alen Mattich.WSJ.

Wednesday, December 22, 2010

Japans Economy Shows signs of Tanking

Crowded street in Japan. Click image to expand.
Will The Rising Suns Economy Set?

When the financial world tries to anticipate the next meltdown, all eyes turn to Europe. Greece needed a bailout, then Ireland did. Talk is that Spain will follow, though the country denies that it has a problem.

But a few contrarians think everyone is looking in the wrong direction. Forget Europe, they say. Check out Japan instead. "A global fiasco is brewing in Japan," predicted Societe Generale analyst Dylan Grice in a recent report. "It's like the Titanic has already hit the iceberg and you know it's going to sink, you just don't know how long it will take to go down," said Vitaliy Katsenelson, a Denver-based money manager, in a recent interview that was printed in well-known analyst John Mauldin's newsletter. One hedge fund analyst I spoke to recently noted that Japan has had no fewer than nine finance ministers in the last 4½ years—one of whom apparently committed suicide after resigning.

Japan was thought to possess a miracle economy before it all went to hell in the early 1990s following a spectacular real estate bust. Today the popular perception is that Japan is stagnant but stable. After the economy slowed down, the Japanese government lowered taxes and increased spending, sending deficits, and also government debt, way up. But the debt hasn't been a problem, because Japan's risk-averse populace—which became even more risk averse after the collapse of the technology bubble a decade ago—has sunk its considerable savings into government bonds, known colloquially as JGBs. What could be safer than government debt? As a result, the vast majority of Japanese debt is funded by its own residents—in stark contrast to the United States, which sells a sizable chunk of its debt overseas. And as deflation struck the Japanese economy, the interest rate on its outstanding debt has fallen to an average of a mere 1.5 percent.
In sum, the Japanese government has been able to increase its debt without driving borrowing costs up because of falling interest rates. That fortunate circumstance has allowed Japan to ramp up government spending even as tax revenue has dropped by nearly one-third .The not-so-lucky part is that even at today's low interest rates, Japan's interest on its debt is eating up a scary proportion of its tax revenue—more than 25 percent (not including the funds that come from issuing yet more debt), according to government figures. In addition, much of Japan's debt is relatively short-term in nature, meaning that the government last year had to "roll" at least 140 trillion yen in debt (i.e., replace retiring debt with new debt) even as it issued some 50 trillion in fresh debt to fund the growing gap between what the government spent and what it took in.
Advertisement
As Bernie Madoff would tell you, this is a game you can play only so long. Japan's savings rate, which was once in the mid-teens, is quickly approaching zero. Meanwhile, the country has the oldest population in the world, with basically no immigration. When people retire, what do they do? They start to withdraw money from the banking system. You begin to see the problem.
Why, you might ask, can't Japan do what us profligate folk in the United States do—sell its debt to international investors? Well, it could, but it would likely have to pay a much higher interest rate than 1.5 percent. After all, if you were an investor, why would you buy Japanese debt yielding 1.5 percent when you could buy U.S. or German debt that paid you more? My source thinks Japan would have to pay roughly 4.5 percent interest on 10-year debt to be competitive, and he says that's a conservative estimate. But that would create a different problem. If Japan's interest rates merely doubled, from 1.5 percent to 3 percent, then interest expense would be more than half of the government's tax revenues. "Any meaningful re-pricing of Japanese sovereign risk would push yields to a level the government would be unable to pay," writes Grice.
Another way for Japan to dig itself out of this hole would be to cut spending. But already, Grice says, Japan's tax revenues can't cover debt service combined with social security. So where the hell do you start?
Those who believe in historical precedent point to examples like Weimar Germany and say Japan is going to swing from deflation to hyperinflation. The Bank of Japan, they say, will print yen in order to pay down debt. "Cash-strapped governments," observes Grice, often resort to "currency debasement." That story never ends happily.
But at least so far, the consensus is that this dire scenario won't, can't, happen. Indeed, it's often said that you aren't a real macro trader (someone who bets on global trends) until you've gotten burned shorting (i.e., betting against) Japan. "You'll find 10,000 people saying I'm an idiot and that people have been saying this, and been wrong, for 15 years, and kid, shut up," laughs my source. The Bank of Japan says the economy is improving; analysts say the government has lots of options, including raising the value-added tax or having the banking system put even more assets into government bonds. (Already, the Bank of Japan is engaged in its own form of "quantitative easing," or purchasing government bonds, which, just as in the United States, is supposed to help the economy recover.) Japan's relatively healthy corporate sector could take over from households in investing its surplus cash into government bonds. "Everyone acknowledges the long term seriousness of Japan's fiscal position," writes Grice. "But people seem almost fatigued with the idea that a country which has defied bond market logic for so long now is ever going to change."
But just because things haven't changed doesn't mean they won't. While any deterioration in Japan's finances should, mathematically speaking, happen gradually—savers don't yank their money out of the system all at once—modern markets have a way of accelerating underlying problems into crises with remarkable speed. If there's a lesson we should all have learned, it's that once fear takes hold, anything can happen. And if Japan is a problem, it's a problem for all of us. After all, Japan is still the world's third-largest economy. Unlike Greece and Ireland, it is simply too big to bail out, even if the world were willing to do so. China and Japan are the largest foreign holders of U.S. debt. One obvious question is, what happens here if Japan starts selling?
There's another way in which Japan's problems might matter, too. In some important ways, the United States is following in Japan's footsteps—for instance by taking advantage of low interest rates to issue a slew of cheap debt. Japan's "more profound influence might be psychological," Grice writes. What he means is that Japan's benign experience with debt (so far) has led other countries (notably ours) to think that it can have a worsening fiscal condition yet still pay a low interest rate on its debt . If bond markets begin to act like that notion is wrong, this story doesn't end happily for anyone.